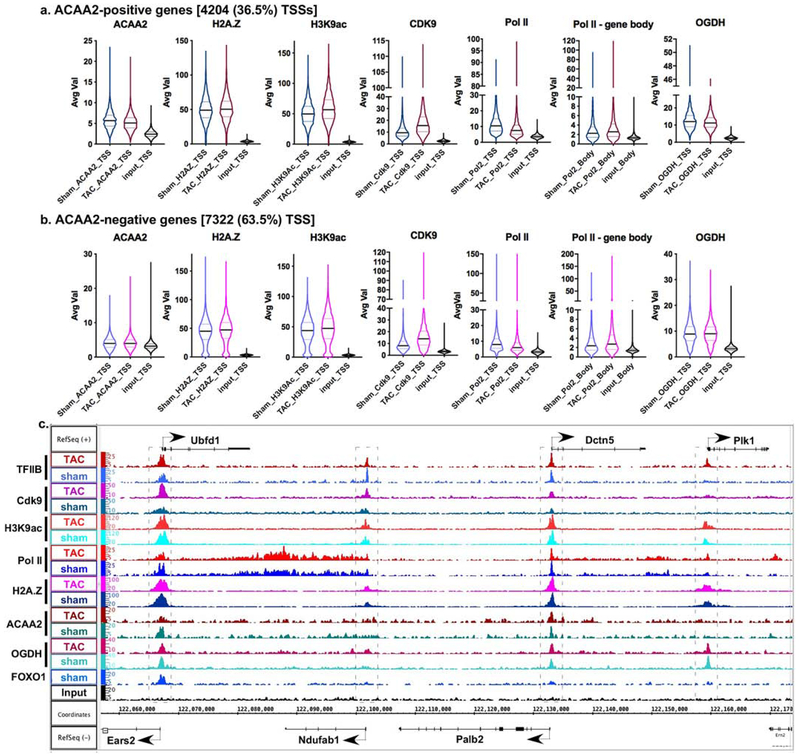
Figure 4. ACAA2 binds selectively to the TSS of genes and is differentially regulated during growth.
Mice were subjected to a sham or TAC operation to induce hypertrophic growth. One-week post-TAC, the hearts were isolated and analyzed by ChIP-Seq for ACAA2. Using the sequence tags, expressed genes (pol II-positive) were sorted into: a. those that bind ACAA2 (ACAA2-positive) and b. ACAA2-negative, at the TSS. They were sorted in parallel with the sequence tags from H2A.Z, H3K9ac, Cdk9, pol II, and OGDH ChIP-Seq, at the TSS (−1000 to + 1000). The results were plotted as violin plots, in which the horizontal solid line represent the median, and the dashed lines the quartiles, and the shape of the violin reflects the tags’ density distribution. c. The alignment of the ChIP-Seq sequence tags for TFIIB, Cdk9, H3K9ac, pol II, H2A.Z, ACAA2, OGDH, and FOXO1 (y-axis) across the genome’s coordinates (x-axis) of a region encompassing Ubfd1, Ndufab, Palb2, Dctn5, and Plk1 genes. The arrow shows the start and direction of transcription.

