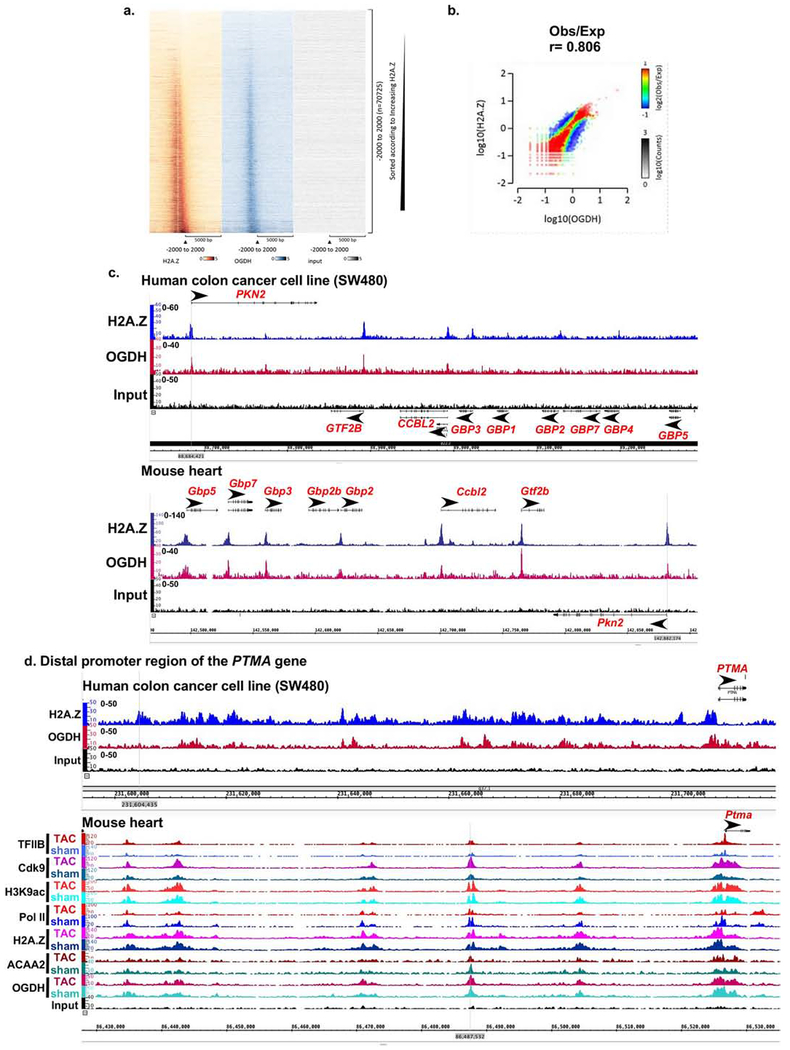
Figure 6. Conserved binding of OGDH to H2A.Z-bound TSSs in human SW480 colon cancer cells.
SW480 cancer cells were cultured, chromatin isolated and subjected to ChIP-Seq using anti-H2A.Z and anti-OGDH. a. Heatmaps of the ChIP-Seq sequence tags H2A.Z (brown), OGDH (blue), and input (grey) aligned at the TSS. The y-axis represents individual positions of bins, and the x-axis represents a region from −5000 to +5000 bp relative to the TSS. b. Histograms showing the distribution of fragments calculated from their overall frequencies in the ChIP-Seq of H2A.Z (y-axis) versus OGDH (x-axis) over the length of the gene and including −2000 bp upstream of the TSS. The x- and y-axes were segmented into 75 bins, and the number of fragments within each bin was counted, color coded, and plotted. The bar to the right of the plot illustrates the relationship between count and coloring. The plots represent pseudo-colored 2D matrices showing observed/expected distribution, calculated from the overall frequencies of fragments on each of the axes. This plot shows the relation between H2A.Z and OGDH relative to what is expected if they occurred by chance. The pseudo-color corresponds to the Obs/Exp ratio, and the color intensity is proportional to the log10 of the number of observed fragments within each bin. These plots suggest that there is a positive correlation between the binding of H2A.Z and OGDH, where the red indicates that this occurs more frequently than expected by chance, as denoted by the correlation coefficient listed above the histogram. c.-d. Both human SW480 colon cancer cell line and mouse heart tissue, were subjected to H2A.Z and OGDH ChIP-Seq using the same antibodies and chromatin concentration. The resulting seqns were aligned across the coordinates for the same genes in the mouse and human genomes, as indicated. c. The region encompassing PKN2, GTF2B, CCBL2, GBP1-5,7 genes that show conserved co-localization of OGDH and H2A.Z at the TSS of the former 3 genes in the mouse and human. d. The region encompassing the distal promoter of the PTMA gene.

