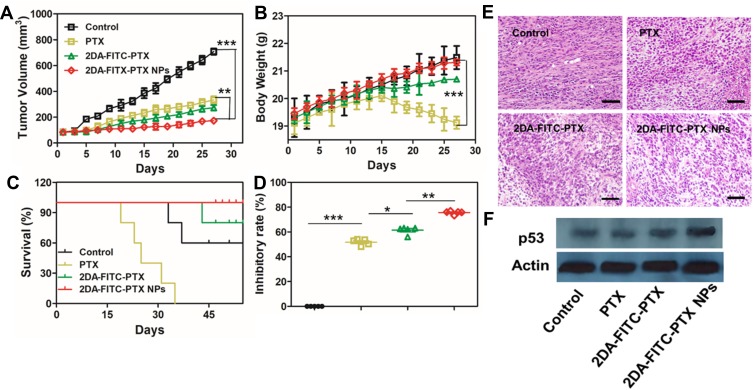
Figure 6.
In vivo antitumor evaluation. (A) MDA-MB-231 tumor growth curves, (B) body weight with various treatments, (C) survival curve, and (D) tumor growth inhibition rates (n = 5). *P < 0.05 and **P < 0.01. (E) Tumor tissue images under various treatments. Scale bars are 100 μm. (F) Tumor tissue Western blotting results of p53 expression under various treatments: *P < 0.05, **P < 0.01, and ***P < 0.001.
Abbreviations: PTX, paclitaxel; 2DA-ICG-PTX, 2-glucosamine-fluorescein-5(6)-isothiocyanate-glutamic acid-paclitaxel; 2DA-ICG-PTX NPs, 2-glucosamine-fluorescein-5(6)-isothiocyanate-glutamic acid-paclitaxel nanoparticles.

