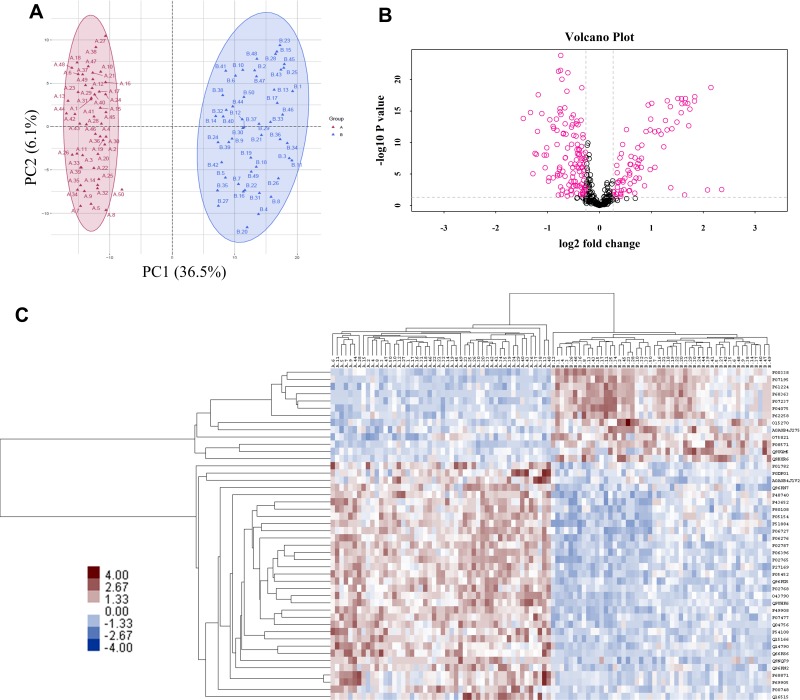
Figure 1.
Features of the plasma proteome dataset from label-free quantitative proteomics analysis. (A) The PCA plot was used to check and distinguish the 5278 peptide fragment ions between the two groups. A represents individuals in HIV-nonTB group and B denotes individuals in HIV-TB group; (B) a volcano plot of proteins in HIV-TB relative to HIV-nonTB group; (C) hierarchical cluster analysis of the 46 differentially expressed proteins.

