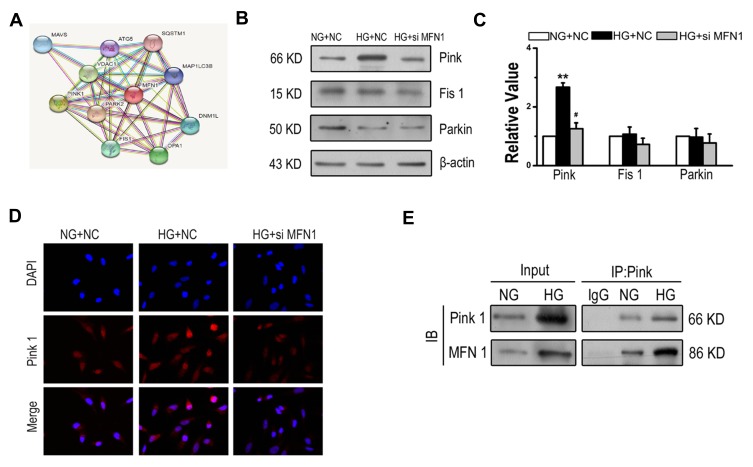
Figure 6.
Glucose enhanced the interaction of MFN1 and Pink in A549 cells. (A) Predicted protein-protein interactions with MFN1 according to the STRING database. (B and C) The expression levels of Pink, Parkin and Fis1 were examined by Western blot in A549 cells after exposure to glucose for 24 hours. (D) Immunofluorescence of A549 cells from NG+NC, HG+NC, and HG+siMFN1. Cells were stained with DAPI (blue) and Pink (red). (E) A549 cells were exposed to 25 mM glucose, and whole cell lysates were extracted for co-immunoprecipitation with anti-Pink, and subsequent probing with anti-MFN1. Scale bar = 100 µm. Data shown are mean ± SEM. **P < 0.01 vs NG+NC group. #P < 0.05 vs HG+NC group (n = 4).
Abbreviations: NC, non-targeted control; NG, normal glucose; HG, high glucose. MFN1, mitofusin1; siMFN1, small interfering RNA of MFN1; Pink, PTEN induced kinase; DAPI, 4ʹ,6-diamidino-2-phenylindole. IB, immunoblotting; IP, immunoprecipitation; STRING, https://string-db.org/.

