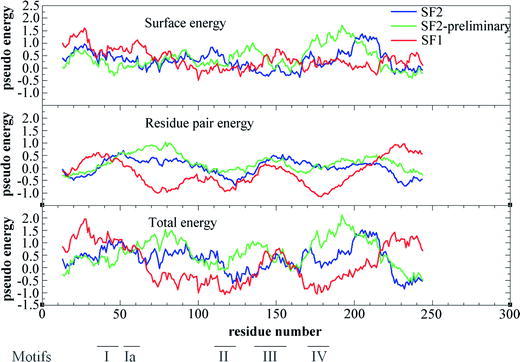
Fig. 5.

Pseudo-energies of residue-pair and surface by Prosa II. The pseudo-energy is calculated with the potentials of Prosa II (residue pair energy, surface energy and total energy) and the average of a window of 25 residues is plotted versus the middle point of the window along the sequence. The energy for the SF2 model is plotten in blue, the energy for the SF-2 preliminary in green and the energy for the SF1 model in red. The regions corresponding to SF1 helicase motifs of are indicated at the bottom of the figure.
