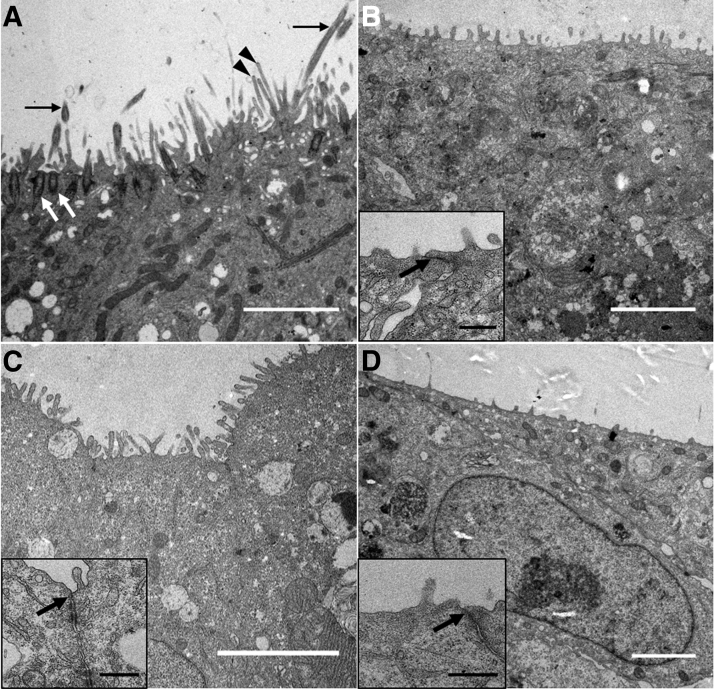
FIG. 3.
Ultrastructure of 3D airway mucosa tissue models using different airway epithelial cell lines. HBEC3-KT-based models show kinocilia on the apical surface (black arrows). Basal bodies are clearly visible (white arrows) and microvilli (black arrowheads) line the epithelial surface (A). Tissue models generated with VA10 (B), Calu-3 (C) or Cl-huAEC (D) show microvilli and tight junctions (arrows in insets B–D, respectively) on the epithelial cell surface. Scale bars: 3 μm (A–D), 0.5 μm (insets).

