FIG. 2.

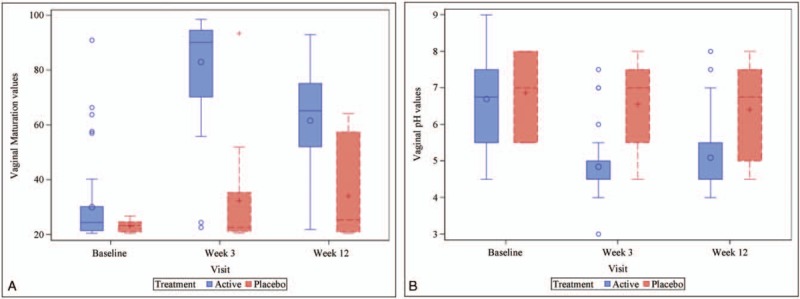
Boxplot of the vaginal maturation (A) and vaginal pH (B) values determined at each of the indicated visits in the active treatment and placebo groups (ITT population). ITT, intent-to-treat.

Boxplot of the vaginal maturation (A) and vaginal pH (B) values determined at each of the indicated visits in the active treatment and placebo groups (ITT population). ITT, intent-to-treat.