
FIG. 3.
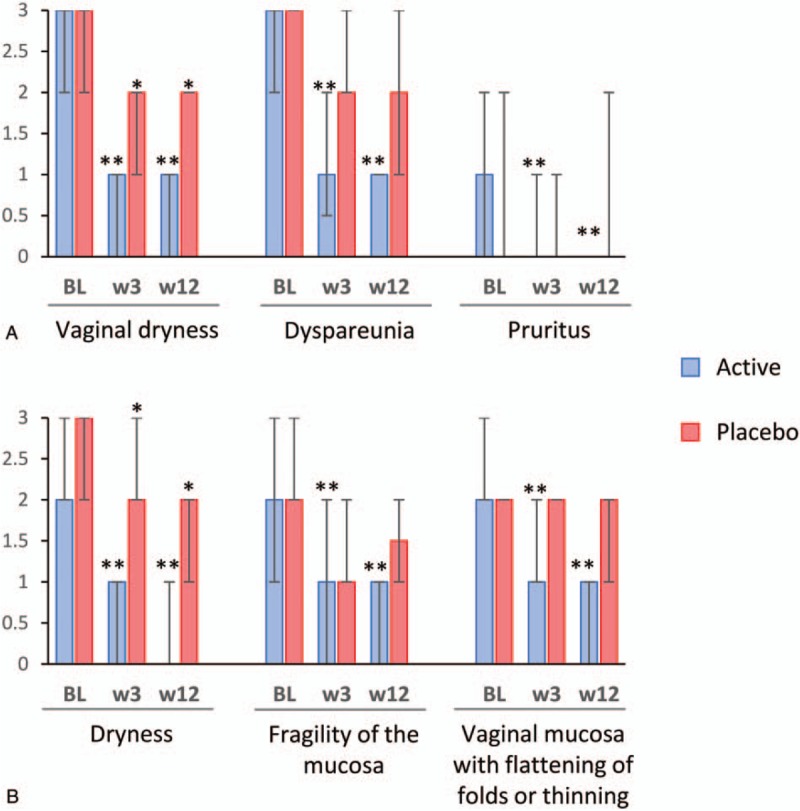
Individual scores of each symptom (A) and signs (B) of vulvovaginal atrophy throughout treatment. Columns and error bars represent median and IQR, respectively. Symptoms/signs severity are presented on a 0-3 scale: 0 = lack of symptoms/signs, 1 = mild, 2 = moderate, and 3 = severe. BL, baseline; IQR, interquartile range; w, week. ∗∗P < 0.001, ∗P < 0.05 for differences between baseline and the given visit.