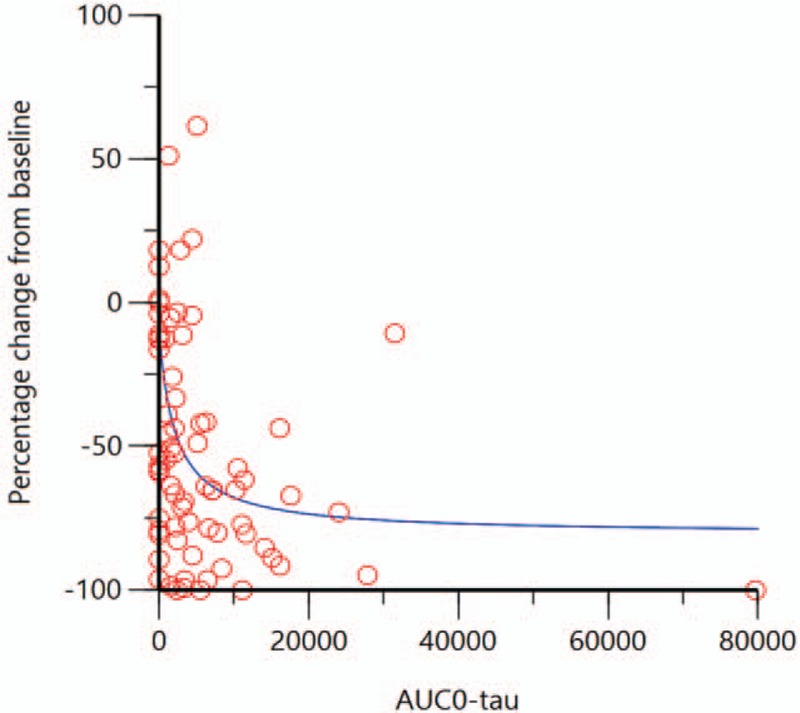
FIG. 3.

Exposure-response model of % change from baseline in frequency of moderate and severe hot flashes versus plasma concentration (area under the curve during the dose interval (AUC0-tau in ng∗h/mL) on day 14 of treatment. (the red circles show individual actual values; the blue line shows the predicted (modelled) response).
