Figure 4.
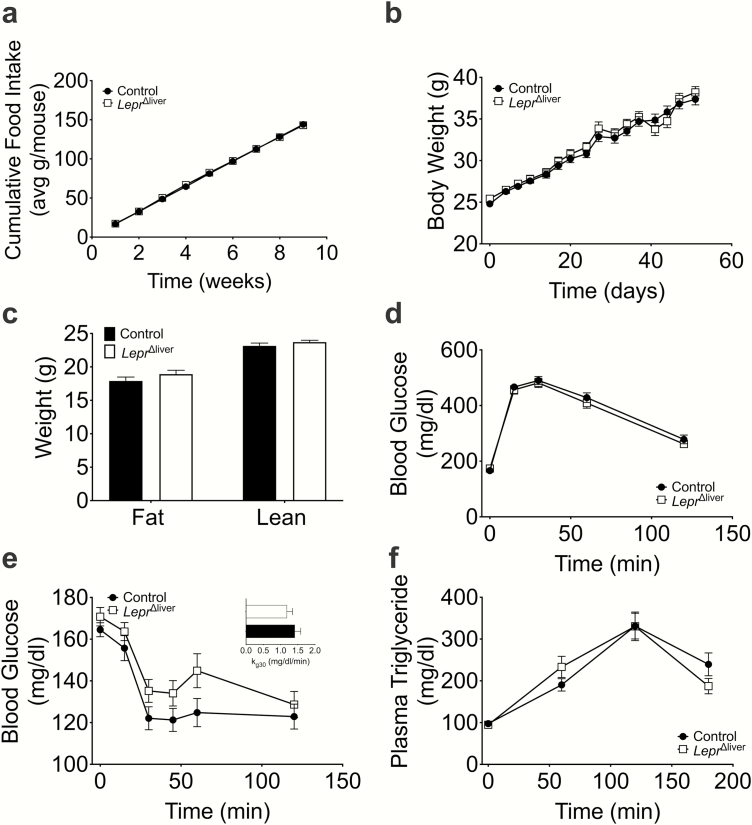
Diet-induced obesity in LeprΔliver mice. (a) Food intake, (b) body weight, and (c) body composition in high fat-fed mice. (d) Glucose (6-hour fast, 1.5 g/kg glucose), (e) insulin (5-hour fast, 0.75 U/kg insulin), (e, inset) kg30, and (f) oral lipid tolerance tests in diet-induced obese control and LeprΔliver male mice (n = 22-27). Data are represented as mean ± SEM.

