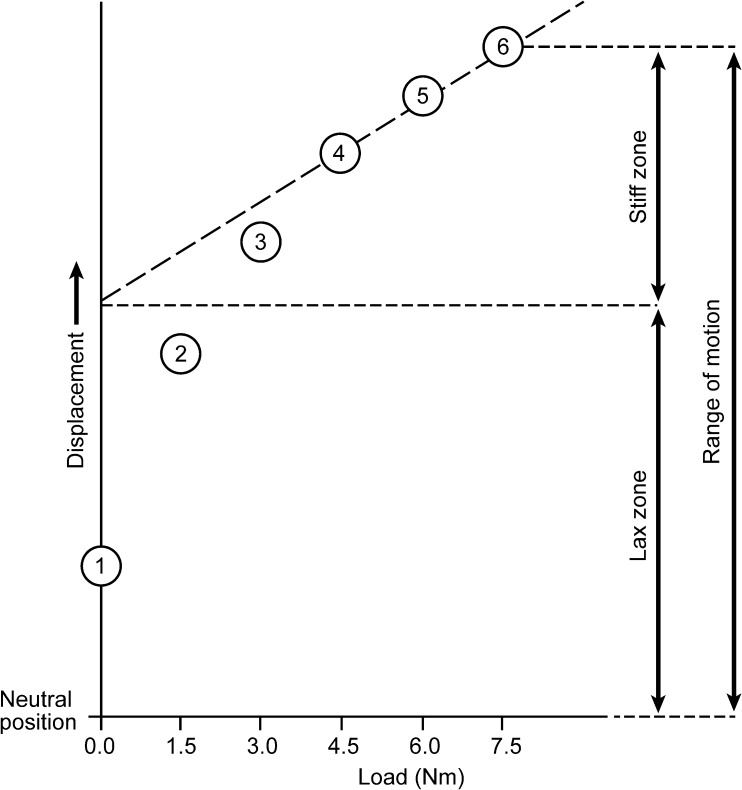
Figure 1.
Graph of biomechanical parameters studied by clinical variables (bone mineral density, age, vertebral body height, and disc height). Each circle represents angular position–data recorded quasi-statically (after holding a steady load for 45 seconds) at the 6 different loads applied. The angular displacement where the lax zone transitions to the stiff zone is found by extrapolating a best-fit to points 4, 5, and 6 to 0 load. The lax and stiff zones sum to provide the range of motion. Used with permission from Barrow Neurological Institute.

