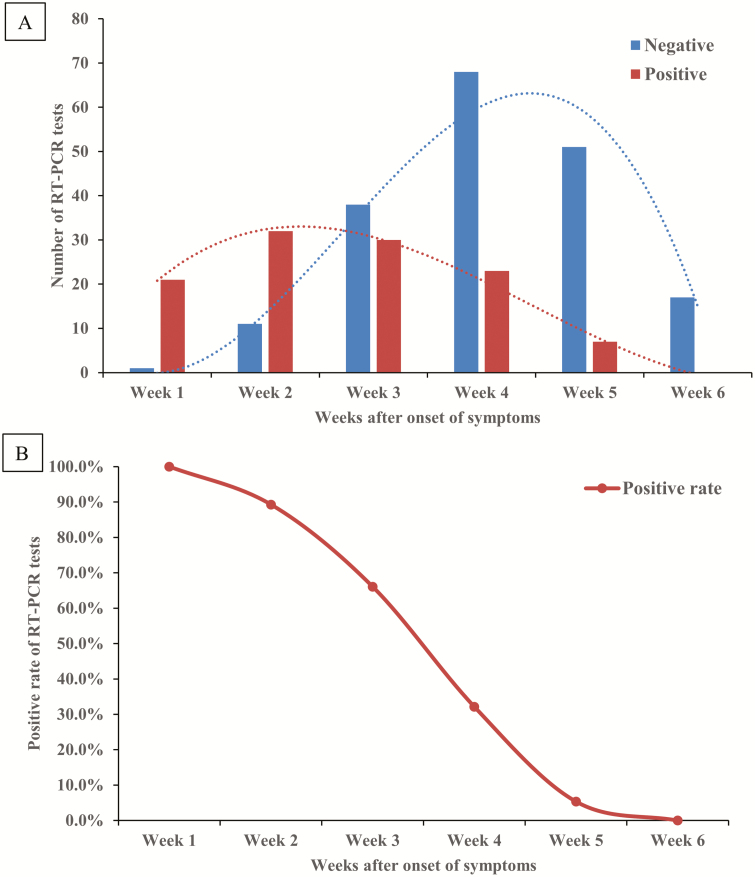
Figure 1.
Dynamic profile of RT-PCR for SARS-CoV-2. A, Dynamic profile of SARS-CoV-2 detected by RT-PCR from 56 patients with COVID-19 (n = 299). Numbers of the positive (red bars) and negative (blue bars) results of SARS-CoV-2 RT-PCR tests were summed on weeks after the onset of symptoms. B, Positive rate of SARS-CoV-2 detected by RT-PCR from 56 patients with COVID-19 (n = 299). Percentages of positive results of SARS-CoV-2 RT-PCR test were calculated on weeks after the onset of symptoms. Abbreviations: COVID-19, coronavirus disease 2019; RT-PCR, reverse transcription–polymerase chain reaction; SARS-CoV-2, severe acute respiratory syndrome coronavirus 2.

