FIGURE 4.
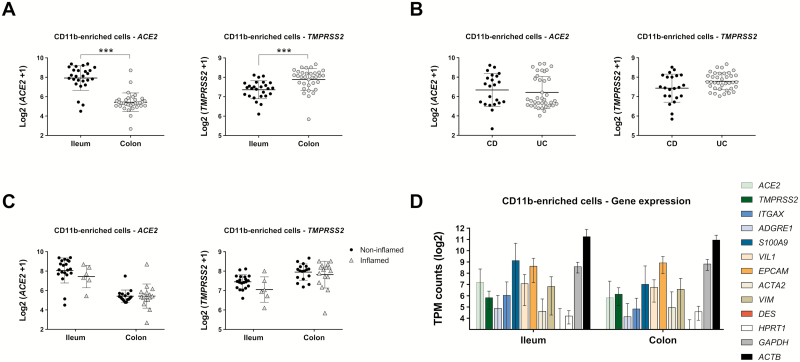
ACE2 and TMPRSS2 expression in CD11b-enriched cell isolates from biopsies of patients with IBD. Cells isolated from mucosal biopsies were analyzed via RNA sequencing and expression of SARS-CoV-2 entry genes was determined. Expression levels shown were analyzed using mixed-effects models to properly account for correlations within patients; these models correct the effect of multiple samples collected from the same patient. A, Differential expression of genes in ileum (n = 26) and colon (n = 33) samples from n = 31 patients; ***P < 0.001. B, Differential expression of genes in CD (n = 22) and UC (n = 37) samples from n = 31 patients. C, Differential expression of genes in different segments of the gut segregated by inflamed and noninflamed pathology. D, TPM of selected genes expressed in CD11b-enriched cell isolates and segregated by gut location; n = 26 (ileum) and n = 33 (colon) samples.

