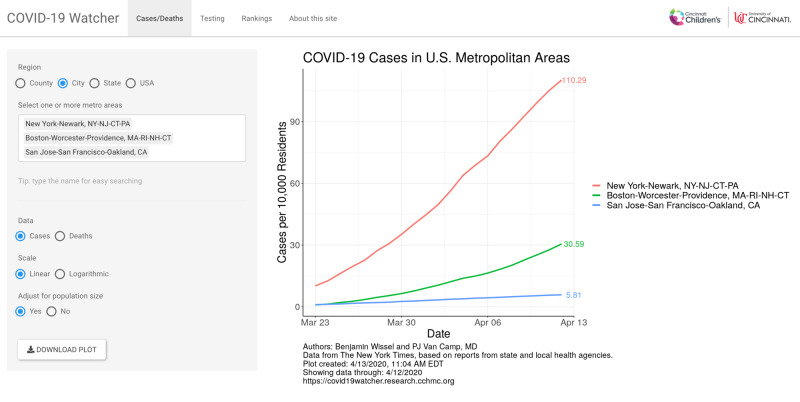
Figure 1.
Screenshot of the COVID-19 Watcher web resource. Users can view data from The New York Times at the county, city, state, or national level. Multiple areas can be compared at once. Plots for the selected regions automatically generate and have options to view on logarithmic scale or normalize data by the population size. COVID-19: coronavirus disease 2019.

