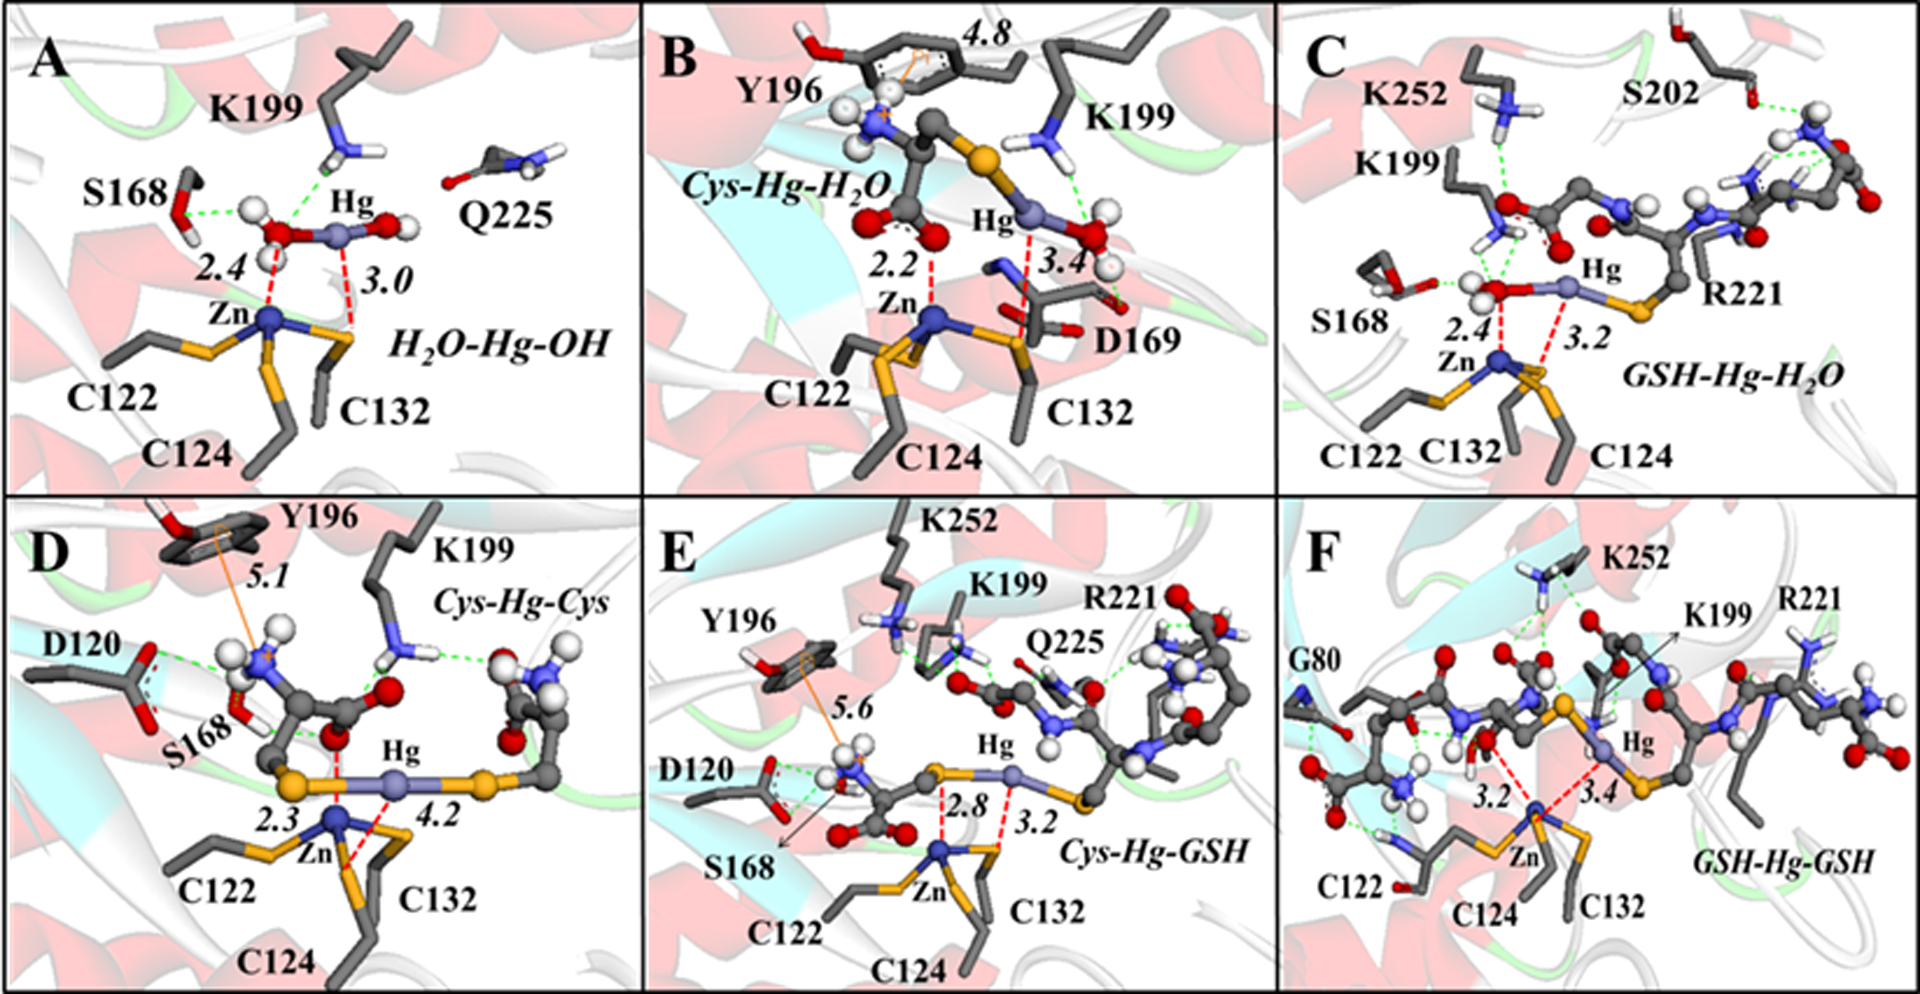
Figure 10.

Interactions between the Hg2+ species with δ-AlaD. H-bonds are shown in green dotted lines, Zn⋯O and Hg⋯S interactions are in red dotted lines, and the cation-π interactions are in orange lines. Only the main residues involved in the interactions are shown. The distances are in Å and the molecular docking simulations were carried out with the Auto Dock Vina 1.1.1 program (Trott and Olson 2010) using the docking configuration according to Nogara and Rocha 2017.
