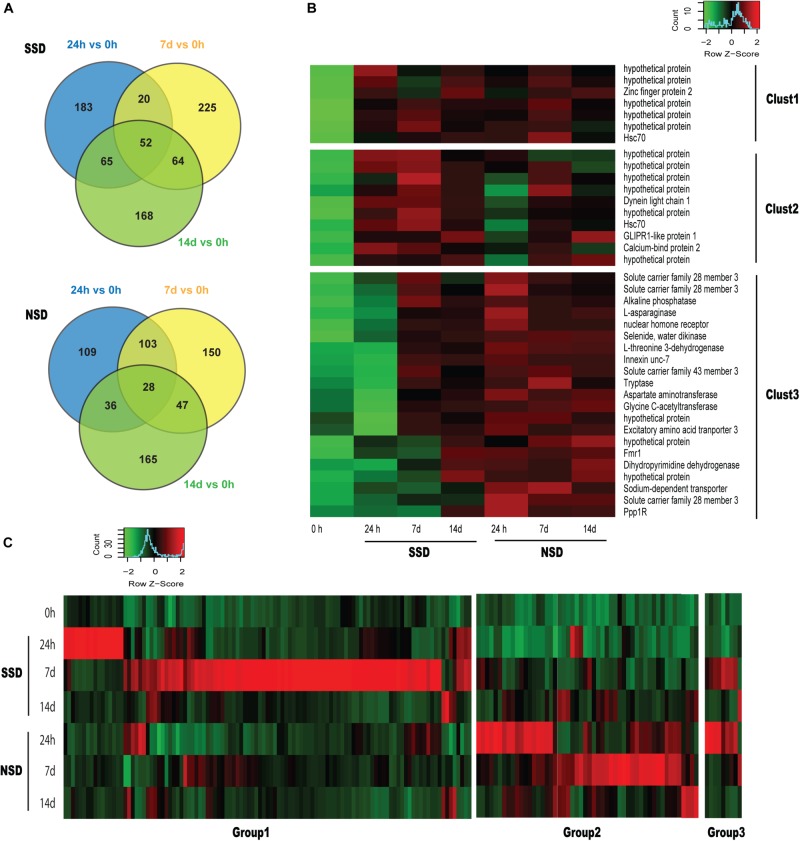
FIGURE 2.
Dynamic transcriptomic changes over time. SSD: in vitro culture of PSC with bile salt strobilization stimulus; NSD: in vitro culture of PSC without bile salt strobilization stimulus. (A) Venn diagram showing the number of overlapping differentially expressed genes (DEGs) across pairwise comparisons at each time point compared to the baseline (0 h). (B) Heat maps of sequencing data from 38 overlapping DEGs identified in Figure 1A. Clust1 represents 7 DEGs which were significantly increased in the both SSD and NSD. Clust2 and Clust3 represent 10 and 21 DEGs, respectively, which were specifically and consistantly over-expressed in SSD and NSD. A P-value < 0.05 and a fold-change >2.0 were used as the threshold criteria to define significant differences. (C) Heat maps showing 172 DEGs which were specifically over-expressed at SSD or NSD (118 in the SSD and 63 in NSD). Groups1 and 2 respectively represent 109 and 54 DEGs which were only up-regulated in SSD or NSD. Group 3 includes 9 DEGs which were simultaneously over-expressed in SSD and NSD.

