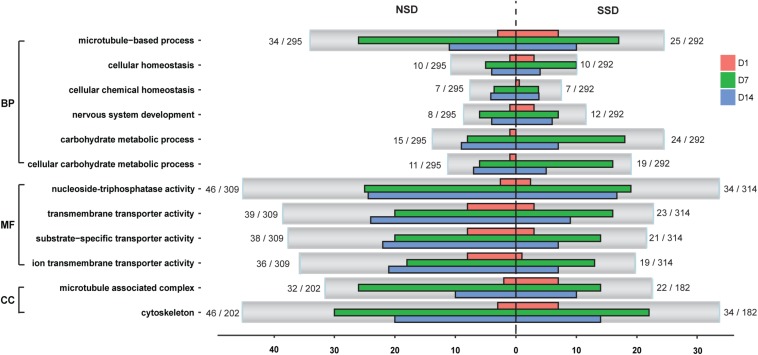
FIGURE 3.
Classification of GO annotations. The X-axis indicates the number of genes in a sub-category and the Y-axis indicates the GO sub-categories. D1, in vitro culture for 24 h; D7, in vitro culture for 7 days; D14, in vitro culture for 14 days. SSD, in vitro culture of PSC with bile salt strobilization stimulus; NSD, the in vitro culture of PSC without bile salt strobilization stimulus; BP, biological processes; MF, molecular functions; CC, cellular components.

