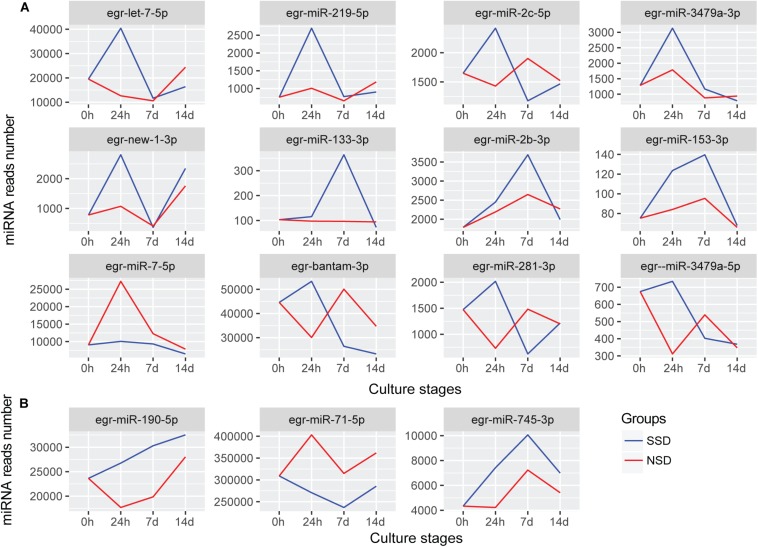
FIGURE 4.
miRNAs with different expression patterns between SSD and NSD. (A) The differentially expressed miRNAs with different expression patterns. (B) The miRNAs were differential expressed throughout the three time-points. The blue line indicates the expression levels of candidate miRNAs during in vitro culture in the presence of the bile salt as strobilization stimulus (SSD). The red line indicates the expression levels of candidate miRNAs during the in vitro culture without the bile salt strobilization stimulus (NSD). The Y-axis indicates the relative expression levels of each miRNA.

