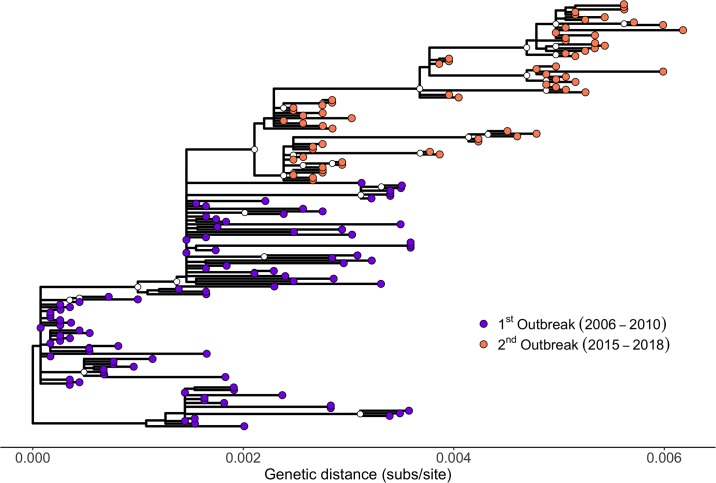
Fig 2. Phylogenetic tree of 164 BTV-8 samples collected during the European outbreaks between 2006 and 2018.
ML tree estimated in PhyML. The scale bar shows substitutions per site. Internal nodes represented 700 or more times within 1,000 bootstraps are indicated by a white circle. Samples from the first outbreak are shown as purple circles, while samples from the second outbreak are shown as orange circles. Note that an identical tree with labels corresponding to the individual samples is shown as S1 Fig. The tree is available in S3 Data as PhyMLTreeFinal.tree. BTV-8, bluetongue virus serotype 8; ML, maximum likelihood.

