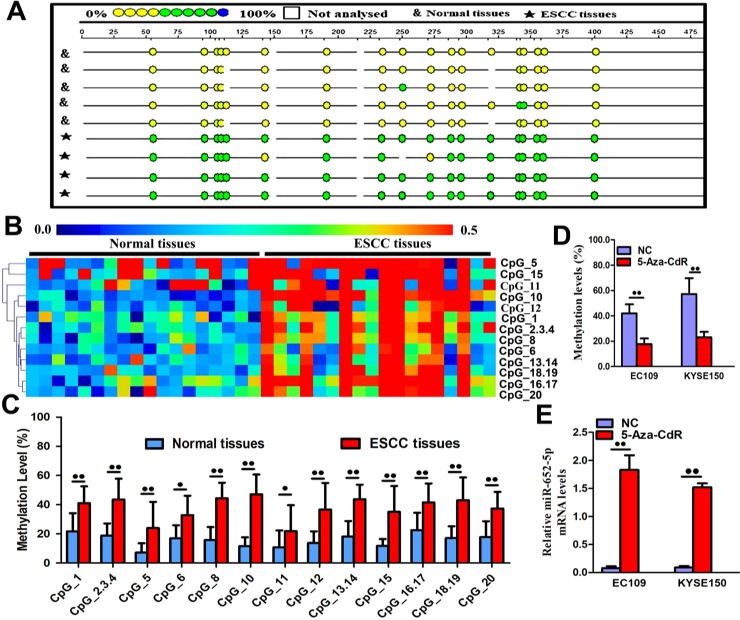
Fig 4. Methylation of miR-652-5p.
(A)The methylation profile of CpG sites in miR-652-5p. The percentage of methylation in each site was indicated by different colours. Boxes show different methylation patterns in OSCC (n = 18) and corresponding normal tissue samples (n = 18). (B) Hierarchical cluster analysis shows CpG sites methylation in miR-652-5p promoter region in 18 OSCC and normal tissue samples. The colour gradient indicates the methylation level (0% to 100%) of each unit in each sample. (C) The distribution of thirteen analysed CpG units in miR-652-5p promoter. (D) Methylation level of miR-652-5p promoter in OSCC cells treated with 5-Aza-CdR. (E) Quantitative measurement of miR-652-5p level in 5-Aza-CdR-treated cells. Data from triplicate experiments are presented.

