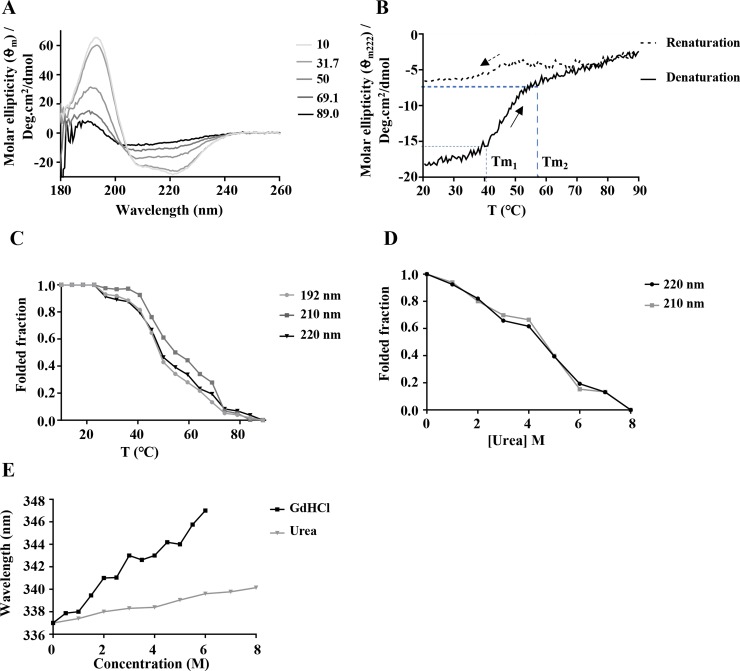
Fig 2. Secondary structure analysis of PfHop.
(A) SRCD spectrum of full-length PfHop. SRCD spectral scans monitoring denaturation of PfHop upon exposure to increasing heat stress (10°C to 90°C). (B) Shown is the CD spectrum of PfHop monitored at 222 nm upon thermal denaturation by upscaling temperature from 20°C to 90°C. Similarly, the CD spectrum for the renaturation attempt of PfHop upon temperature downscale from 90°C to 20°C is illustrated. The thermal transitions (Tm1 and Tm2) are shown. (C) The folded fraction of PfHop as a function of temperature was monitored using CD signals at 192, 210 and 220 nm. (D) Urea-induced unfolding of PfHop is shown. (E) Represents the fluorescence emission spectra of PfHop monitored at 300–450 nm after an initial excitation at 295 nm. The recombinant PfHop protein tryptophan fluorescence emission spectra were recorded under various GdHCl and urea concentrations. Notable, is the red spectral shift obtained for of PfHop exposed to various GdHCl and urea concentrations.

