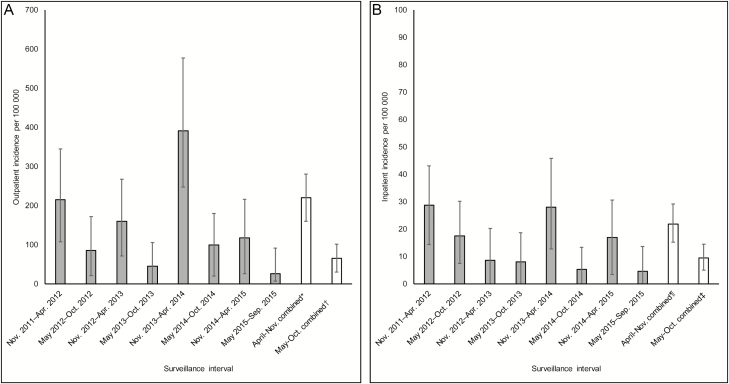
Figure 4.
Biannual annualized norovirus incidence among outpatients (A) and inpatients with community-acquired infection (B) at 4 Veterans Affairs Medical Centers, November 2011–September 2015. *Includes outpatient specimens collected during November 2011–April 2012; November 2012–April 2013; November 2013–April 2014; and November 2014–April 2015. †Includes outpatient specimens collected during May 2012–October 2012; May 2013–October 2013; May 2014–October 2014; and May 2015–September 2015. ¶Includes inpatient specimens collected from patients admitted for acute gastroenteritis during November 2011–April 2012; November 2012–April 2013; November 2013–April 2014; and November 2014–April 2015. ‡Includes inpatient specimens collected from patients admitted for acute gastroenteritis during May 2012–October 2012; May 2013–October 2013; May 2014–October 2014; and May 2015–September 2015.

