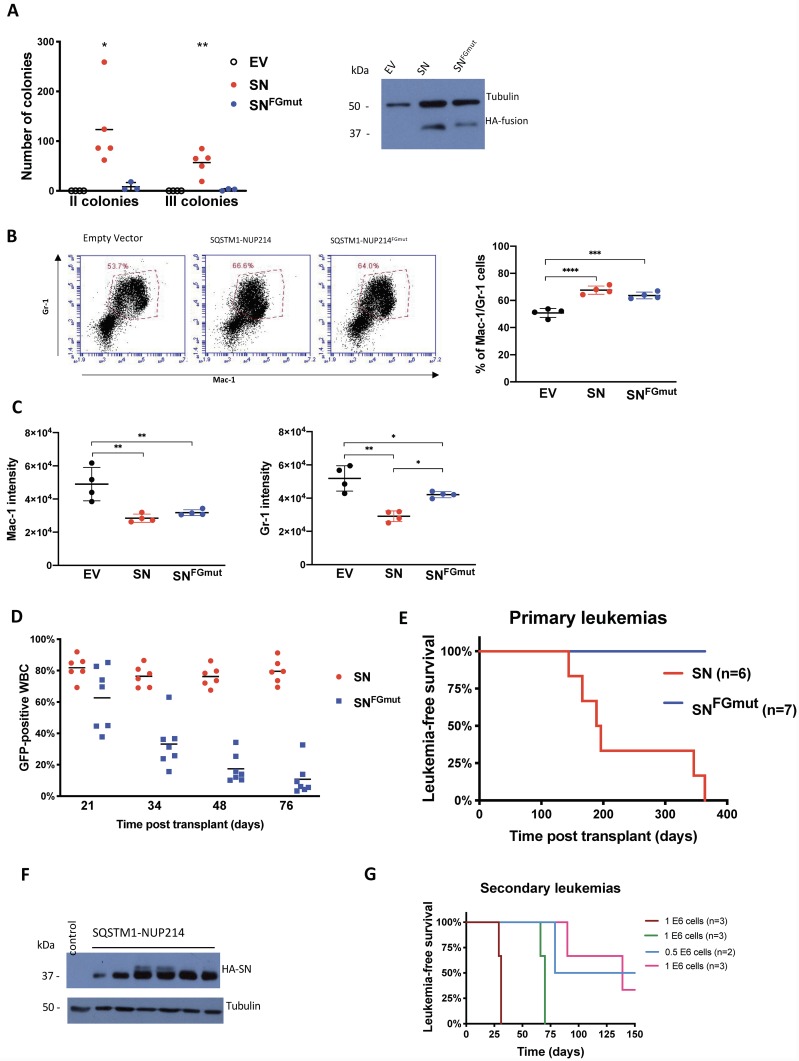
Fig 2. Crm1-interacting FG repeats are necessary for the induction of leukemias by SQSTM1-NUP214.
(A) Colony forming assay of murine fetal liver hematopoietic progenitors transduced by empty vector (EV), SQSTM1-NUP214 (SN) or SQSTM1-NUP214FGmut (SNFGmut). Each data point is the average number of secondary or tertiary passage colonies scored in at least 2 wells, resulting from the seeding of 10 000 cells. The means are shown from experiments repeated 3 to 5 times. The numbers of colonies were compared by one-way ANOVA with Tukey post hoc test. Significant differences are shown in comparison to cells transduced with the empty vector. * p<0.05, ** p<0.01. Expression of the HA-tagged fusion proteins in fetal liver cells transduced with the indicated vectors is shown in the right panel. Protein lysates were prepared from unselected freshly transduced cells collected at the time of seeding to generate primary colonies. Tubulin was used as loading control. (B) Percentage of cells co-expressing the myeloid markers Mac-1 and Gr-1 in primary colonies. Cells transduced with the MSCV-puro vector (Empty vector), SQSTM1-NUP214 or SQSTM1-NUP214FGmut were grown in methylcellulose with puromycin for 7 days and harvested for co-staining with antibodies against Mac-1 and Gr-1 and analyzed by flow cytometry. Representative plots with the analysis gate used to define the population of double positive Mac-1/Gr-1 cells are shown. The graph shows the mean percentage of Mac-1+/Gr-1+ cells ±SD (4 replicates). (C) The mean fluorescence intensity of Mac-1 (left) and Gr-1 (right) expression in cells within the double positive population defined in (B) are shown. The graphs show the mean ±SD (4 replicates), one-way ANOVA was used to determine significance, * p<0.05, ** p<0.01, *** p<0.001, **** p<0.0001 (for B and C). (D) Percentage of GFP-positive white blood cells (WBC) in the peripheral blood harvested at the indicated time points after transplantation of mice with SN or SNFGmut-transduced fetal liver progenitors. The transduction efficiency of the fetal liver cells inoculated to the mice were comparable with 38% of SQSTM1-NUP214, and 43% of SQSTM1-NUP214FGmut-transduced cells expressing GFP. (E) Kaplan-Meier leukemia free survival curves of mice transplanted with SN or SNFGmut-transduced fetal liver progenitors. One of the SNFGmut mice was euthanized at day 255 because of excessive weight loss and displayed an abdominal mass attached to the liver upon necropsy. All other SNFGmut mice died of unknown cause, or were euthanized, between 364- and 466-days post transplantation. (F) Immunoblot analysis of SQSTM1-NUP214 protein expression in bone marrow cells from 6 SQSTM1-NUP214 leukemic mice. The bone marrow of a mouse with a leukemia induced by Hoxa9/Meis1 was used as a negative control. Tubulin was used as loading control. (G) Kaplan-Meier leukemia free survival curves of mice transplanted with 0.5 or 1 million bone marrow cells from 4 different primary SQSTM1-NUP214 leukemic mice (n = 2 or 3 for each cohort). All mice were euthanized 150 days after transplantation.

