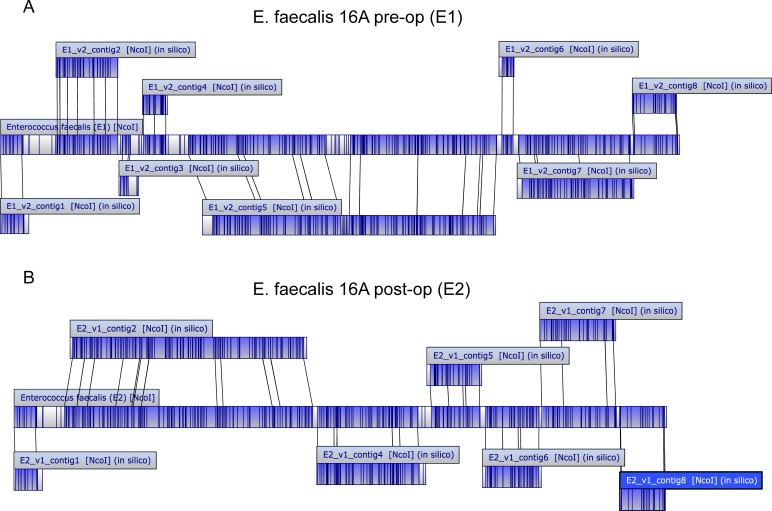
Fig 2. Alignment of scaffolds to optical maps.
(A,B), alignment of the 16A pre-op isolate (A) and the 16A post-op isolate (B). The center long rectangle is the optical map as given by OpGen, and each of the smaller long rectangles represents assembled scaffolds. It shows how each scaffold lines up positionally (and in correct orientation) with the optical map.

