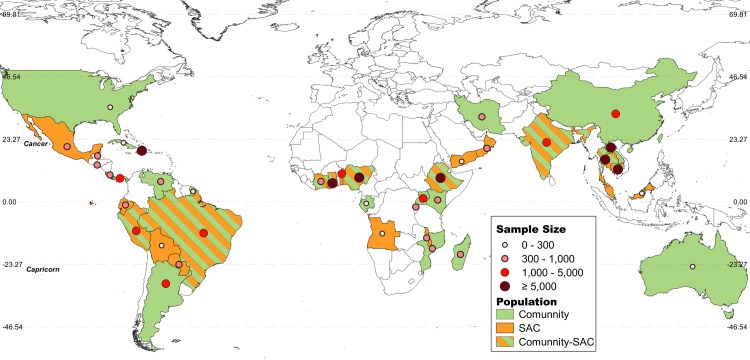
Fig 2. Map of the geographical distribution of the included surveys (n = 127) [20].
The size of each circle is proportional to the total number of surveyed individuals in each country. Countries are represented in green (community based surveys) or orange (school-aged children). Countries with both type of surveys are represented in green and orange bars.

