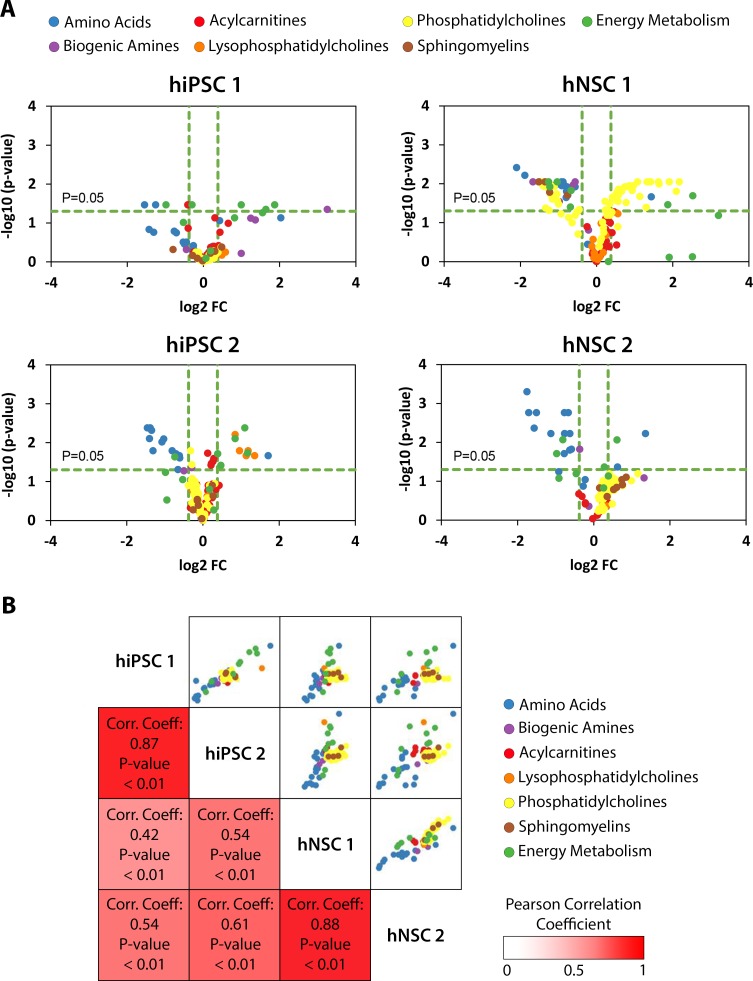
Fig 2. Steady-state changes of hiPSC and hNSC reveal different and conserved responses to the glutamine step.
(A) Volcano plots of steady-state changes of metabolites. The threshold for Type I error (α) is 0.05, with p-value corrected for multiple testing hypothesis (see Materials and Methods), and for a relevant fold-change is 30% difference from initial steady-state. Positive fold-change means increase of intracellular metabolic pool level after glutamine step. (B) Pearson correlation matrix of fold-changes of steady-states of metabolites. Pearson correlation coefficient spans from -1 to 1 where -1 is perfect negative linear correlation, 1 is perfect positive linear correlation and 0 no linear correlation. Typically, Pearson correlation coefficients between 0.7 and 1 denote a strong positive association.

