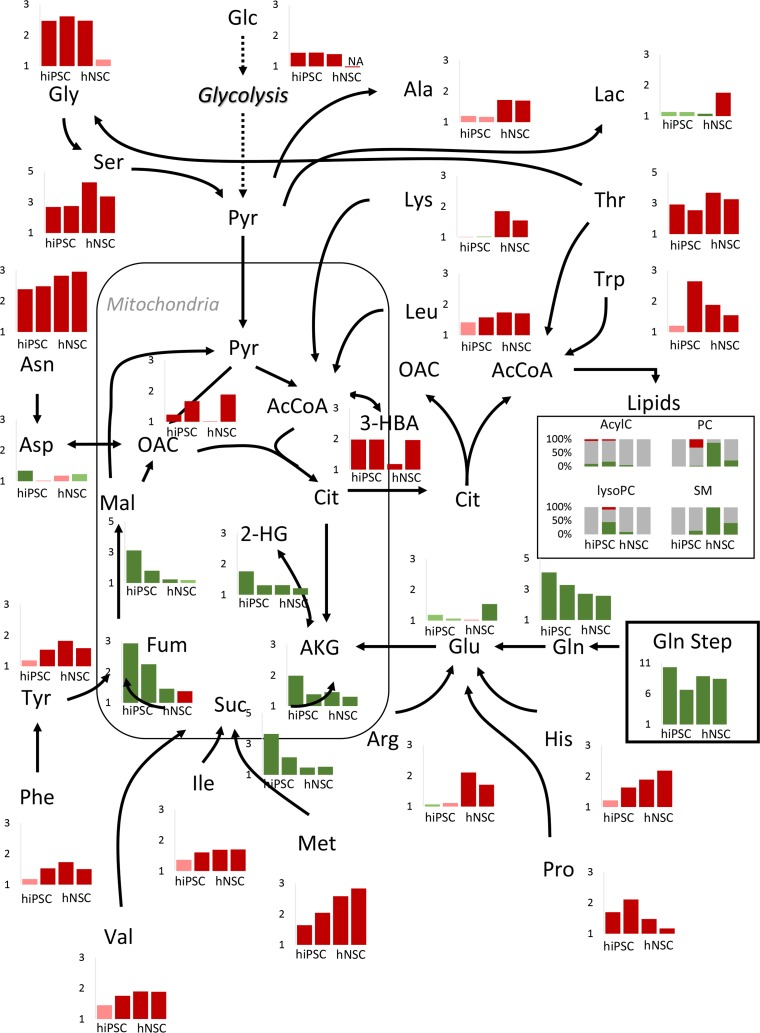
Fig 3. Steady-state fold-changes mapped onto a metabolic network indicate that global responses of intracelular metabolites to glutamine step are cell-dependent.
In each graph, fold-changes bars are depicted in the order hiPSC 1, hiPSC 2, hNSC 1 and hNSC 2. Green bars denote positive fold-changes, red bars denote negative fold-changes, dark colored bars denote fold-changes statistically significant at 5% significance level, light colored bars for fold-changes which are not statistically significant at 5% significance level. In the lipids box, grey bars denote the percentage of lipids that maintained their steady-state, green bars denote the percentage of lipids that reached higher steady-states and red bars the percentage of lipids that reached lower steady-states, at 5% significance level. AcylC: Acylcarnitines, PC: Phosphatidylcholines, LysoPC: Lysophosphatidylcholines, SM: Sphongomyelins.

