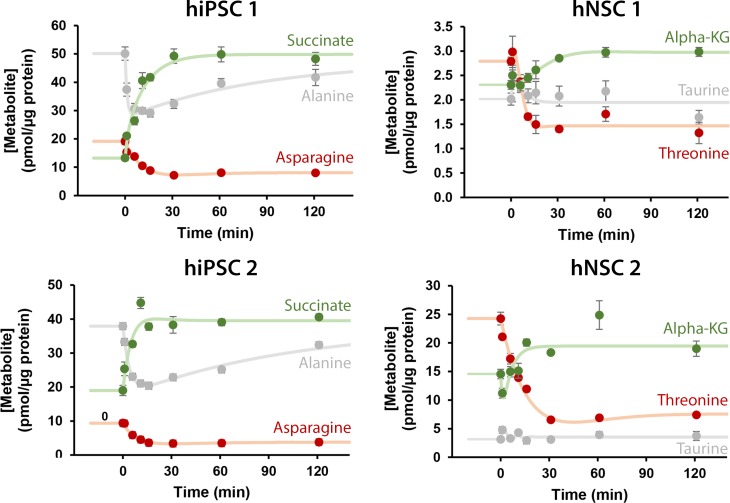
Fig 4. Mathematical model can simulate different types of dynamic responses.
In green, examples of intracellular metabolites that reach a new and higher steady-state after the glutamine step, in red examples of metabolites that reach a new and lower steady-state and in grey examples of metabolites that keep the same steady-state. Data are represented as mean of sampling replicates and error bars represent standard deviation. Solid lines represent the mathematical fitting to the experimental data.

