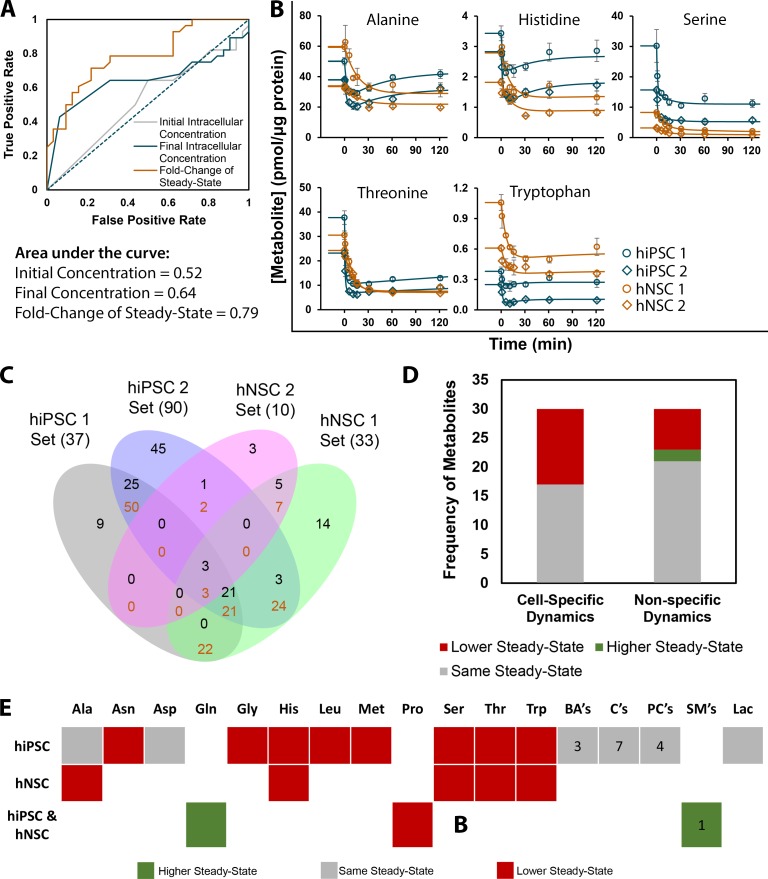
Fig 5. Identification of metabolites with cell type-specific-dynamics reveals the amino acid class as highly conserved in hiPSC and hNSC and that most of the cell type-specific amino acids decreased their steady-state upon glutamine step increase.
(A) Receiver operating characteristic (ROC) curves show the fraction of metabolic pairs correctly/incorrectly identified as deriving from different cells by the application of three models: one based on comparison of initial intracellular concentration, another based on comparison of final intracellular concentration, and the last one based on the fold-change of steady-state after the glutamine step. (B) Metabolic profiles of all metabolites with cell type-specific dynamics in hNSC and their respective cell type-specific dynamics in hiPSC. Experimental points: hiPSC 1 –blue round circles, hiPSC 2 –blue diamonds, hNSC 1 –orange round circles and hNSC 2 –orange diamonds. Adjusted models for cell type-specific dynamics: hiPSC in blue lines and hNSC in orange lines. Data are represented as mean of sampling replicates and error bars represent standard deviation. (C) Venn diagram of metabolites with common dynamics. In each intersection, only metabolites with a mean fitting error below 4% are accepted. Black numbers indicate the number of simulated metabolic profiles which fit, specifically to that region and not to any other region with the same or higher number of intersections. Orange numbers indicate the number of all simulated metabolic profiles that fit to that region, regardless of fitting to other regions with the same or higher number of intersections. (D) Distribution of simulated metabolic profiles according to the steady-state outcome for metabolites with cell type-specific dynamics and with non-specific dynamics (acceptable fits between at least two cell lines of different cell types). (E) Heatmap of metabolites with unique dynamics for hiPSC and for hNSC and of metabolites with dynamics shared by all cells lines, divided in steady-state outcome. Lipids were lumped in classes and the numbers inside its boxes are the number of lipids from that class with dynamics which are cell type-specific or are common to hiPSC and hNSC. BA’s: Biogenic Amines; C’s: Acylcarnitines; PC’s: Phosphatidylcholines; SM’s: Sphingomyelins. (See S5 Table for the total list of metabolites with conserved dynamics).

