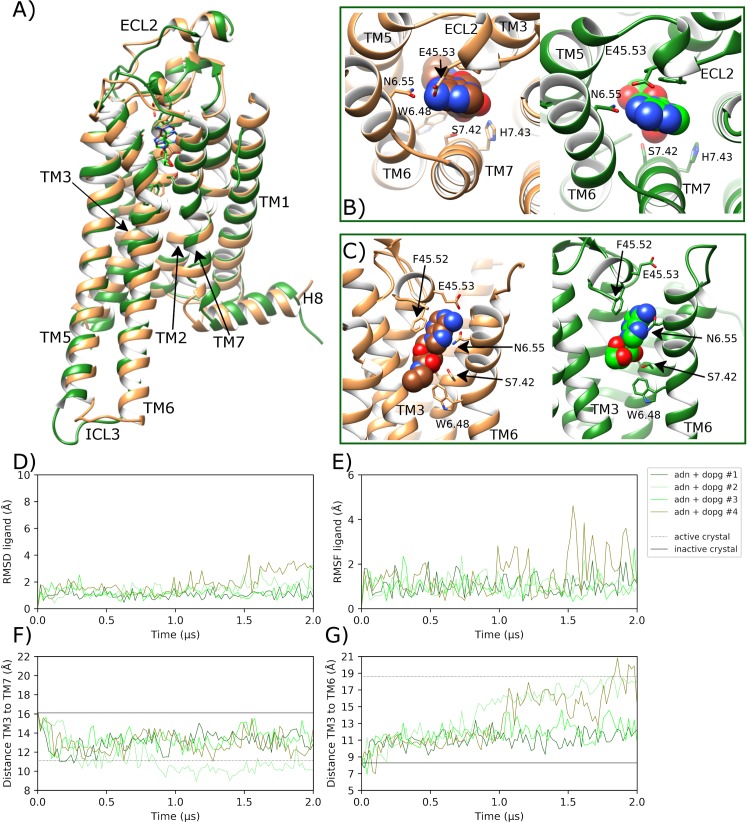
Fig 8. Transition towards an active-like state of A2aR in MD simulations with bound adenosine in a DOPG membrane.
A) Comparison of the MD-generated conformation of A2aR bound to adenosine (ADN) within a DOPG membrane (green, belonging to replica #2 from 0.7 μs) with the active crystal structure of A2aR with bound NECA (brown, PDB entry: 6GDG), showing B) and C) protein-agonist interactions in the orthosteric pocket with adenosine and NECA atoms displayed as spheres. ECL2 and TM helices labelled where applicable. D) RMSD of bound adenosine (calculated with respect to initial docking pose). E) Conformational fluctuation (RMSF) of adenosine. F) Distance between TM3-TM7 (from Cα atoms of R1023.50 and Y2887.53, respectively) during MD simulations starting from the inactive crystal structure (PDB entry: 4EIY). G) Distance between TM3-TM6 (from Cα atoms of R1023.50 and E2286.30, respectively). MD simulations are performed in quadruplicate. Corresponding flat-lines show the observed distance in the active (PDB entry: 6GDG) and inactive (PDB entry: 4EIY) A2aR crystal structures.

