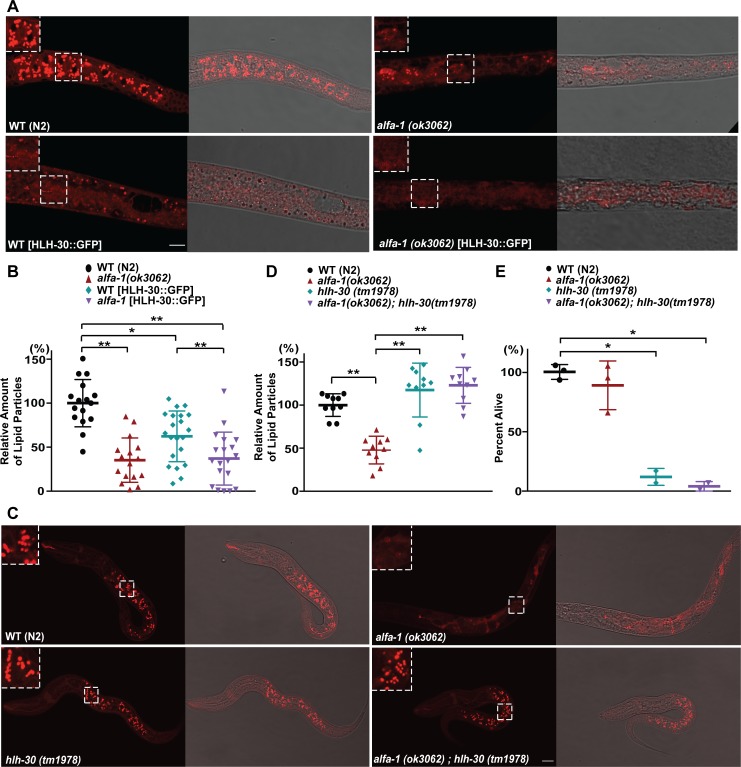
Fig 3. ALFA-1/C9orf72 regulates lipid metabolism through HLH-30/TFEB.
(A) Representative images of Nile Red staining in N2, alfa-1(ok3062), HLH-30::GFP-expressing wild-type and HLH-30::GFP-expressing alfa-1(ok3062) mutant C. elegans after 1 day of starvation. Enlarged images of boxed areas are shown in each panel. (B) Quantification of the lipid particles stained with Nile Red in HLH-30::GFP-expressing wild-type and alfa-1(ok3062) C. elegans. [*p<0.05, **p<0.0001, n = 16 for wild-type and alfa-1(ok3062) C. elegans; n = 21 for HLH-30-expressing wild-type and n = 26 for HLH-30-expressing alfa-1(ok3062) C. elegans]. (C) Representative images of Nile Red staining of N2, alfa-1(ok3062), hlh-30(tm1978), and alfa-1(ok3062);hlh-30(tm1978) within 8 hr after hatching in M9 buffer without food. Enlarged images of boxed areas are shown in each panel. (D) Quantification of the lipid particles stained with Nile Red in hlh-30(tm1978) and alfa-1(ok3062);hlh-30(tm1978). [**p<0.0001, n = 10 for all groups]. (E) Percentage of L1 worms that survived, for N2, alfa-1(ok3062), hlh-30(tm1978), and alfa-1(ok3062);hlh-30(tm1978) after incubation in M9 buffer without food for 8 hr. [*p<0.05, n = 3 for wild-type and alfa-1(ok3062) C. elegans and n = 2 for hlh-30(tm1978) and alfa-1(ok3062);hlh-30(tm1978)]. Distribution of data points is presented with mean ± SD. Scale bar: 20 μm.

