Figure 1.

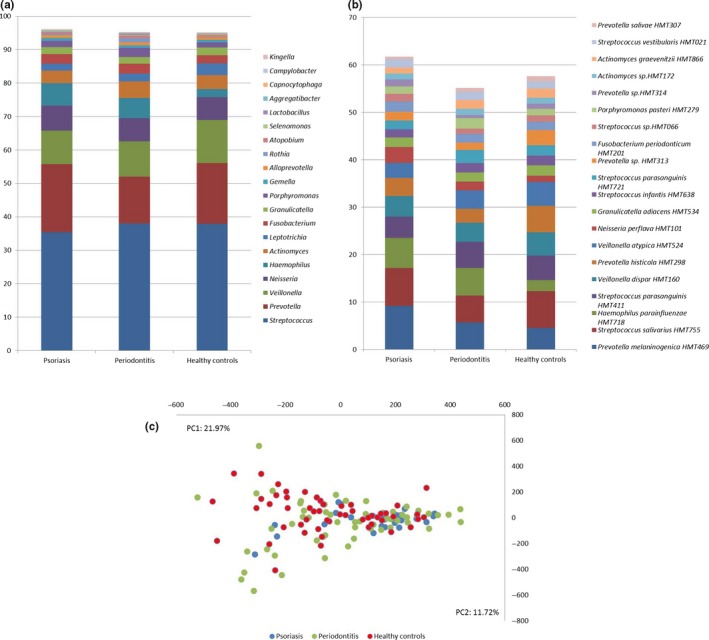
Core salivary microbiota. (a) Relative abundance of predominant bacterial genera expressed as % of total sequences. (b) Relative abundance of predominant bacterial species expressed as % of total sequences. (c) Principal component analysis with x (PC1) and y‐axis (PC2) as the two most decisive components collectively accounting for 33.7% of the variation. Sample denotation: psoriasis: blue, periodontitis: green, and oral health: red
