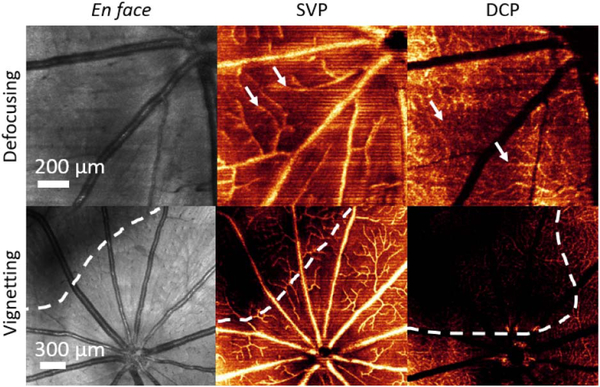
Fig. 1.
En face images of structural OCT and OCT angiograms showing the effects of defocusing and vignetting artifacts. The SVP and DCP are generated from OCTA images. The SVP is defined as the inner 80% of the ganglion cell complex, whereas the DCP is defined between the outer 50% of the inner nuclear layer and the outer plexiform layer [13]. The white arrows indicate the defocused medium and small vessels; the dotted outlines mark the region of the vignetting artifacts.

