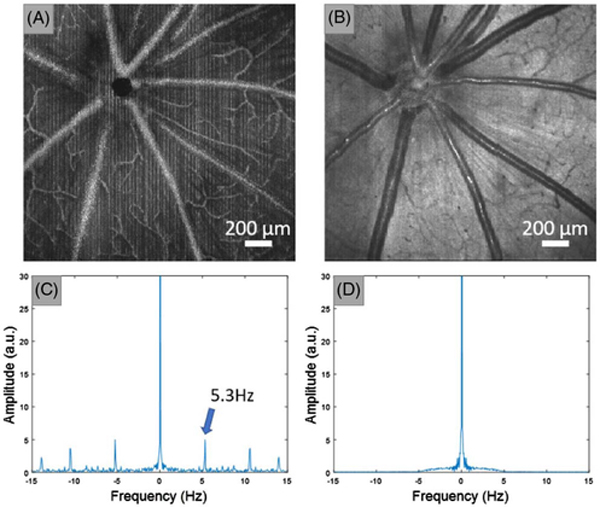
Fig. 2.
Motion artifact induced by heartbeats. The heart rate of rats is approximately 5 Hz (beats/s), which is slow compared to the OCT B-scan rate 98 Hz (scans/s). Thus, the heart beating can only be observed every 20 scans which manifests as the line patterns in OCTA en face images. OCTA images were first averaged along the fast axis, and a DFT was then applied to extract the frequency component of the en face image along the slow axis. The motion artifacts can be observed by additional harmonic frequencies other than the zero-hertz component. (A) En face maximum projection of OCTA. (B) En face average projection of OCT reflectance. (C) Averaged FFT of image (A) along the slow axis direction. (D) Average FFT of panel (B) along the slow axis direction. The numbers in panel (C) indicate the frequency component of the rat heartbeat.

