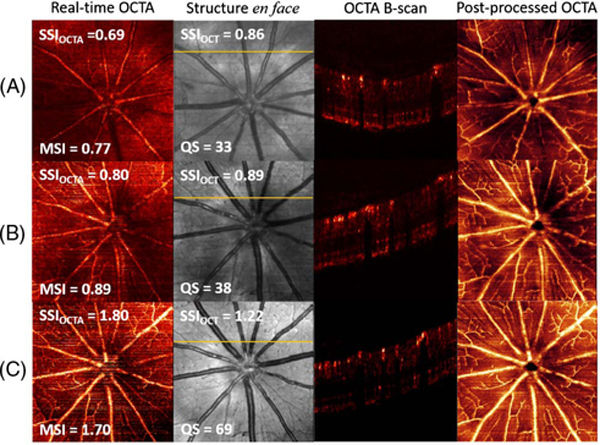
Fig. 6.
Example images without adjustment (row A), after adjusting the focus (row B), and after adjusting both focus and alignment (row C). Real-time en face maximum projection OCTA images and en face mean projection reflectance images were captured in real time during DAQ. The superficial vascular complex angiograms were post-processed after manual segmentation. The OCTA B-frames were selected from the position indicated by the yellow line in the en face structure images. The SSI values from the real-time en face OCT, OCTA, and MSI of OCTA also demonstrated the improvement of scan qualities.

