
Figure 1.
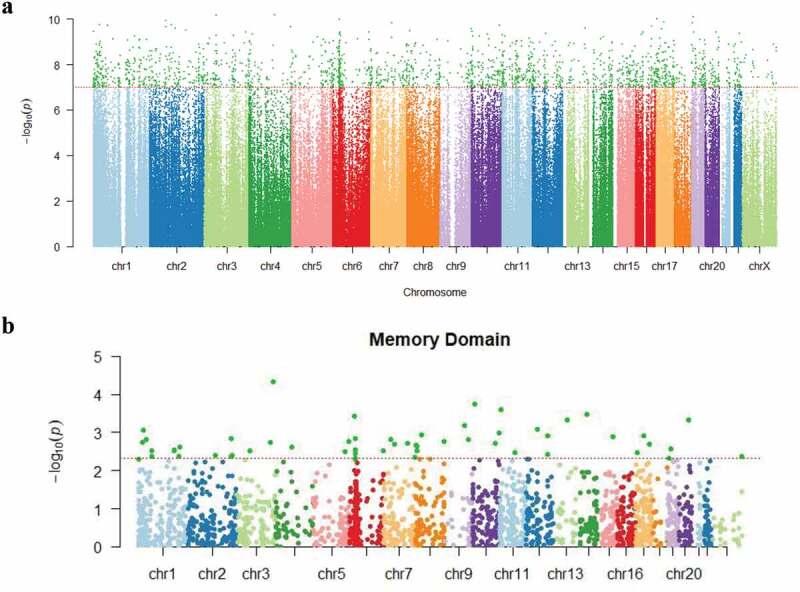
(a). Manhattan plot showing P values for changes in methylation at the individual CpG positions from baseline to one year after the initiation of chemotherapy. The Y axis shows log transformed P values. The X axis shows the chromosomal location of the 485,512 CpG positions evaluated. The dotted horizontal line indicates the threshold for significance (P = 1.03 × 10⁻⁷). (b). Manhattan plot for P values for associations between CpG methylation ratio differences and memory domain score. The Y axis shows log transformed P values. The X axis shows the chromosomal location of the 2,199 positions with significant differences in methylation ratios from baseline to 1 year post chemotherapy induction. The dotted horizontal line indicates the threshold for significance (P = 4.91 × 10⁻³) in associations between memory domain scores and methylation ratio differences, with these 56 CpG sites being highlighted in dark green.