
Figure 2.
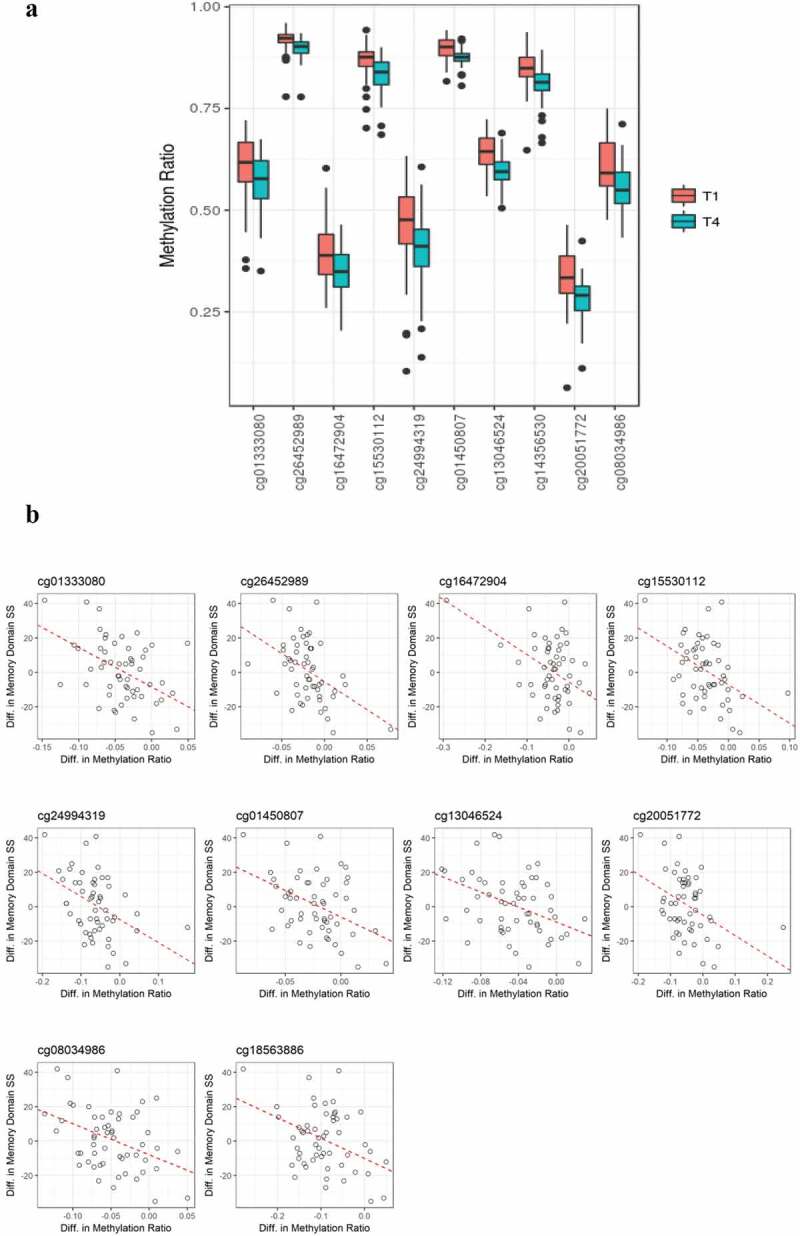
(a). Boxplot showing methylation ratios at T1 and T4 on ten significantly differentially methylated CpG sites. All of these sites showed reduced methylation at T4. Black dots present outliers of the methylation ratios. (b). Directional associations between changes in methylation ratios and changes of memory domain scores at 10 CpG positions. Significant inverse correlations were observed between differences in DNA methylation values and differences in memory domain standardized scores.