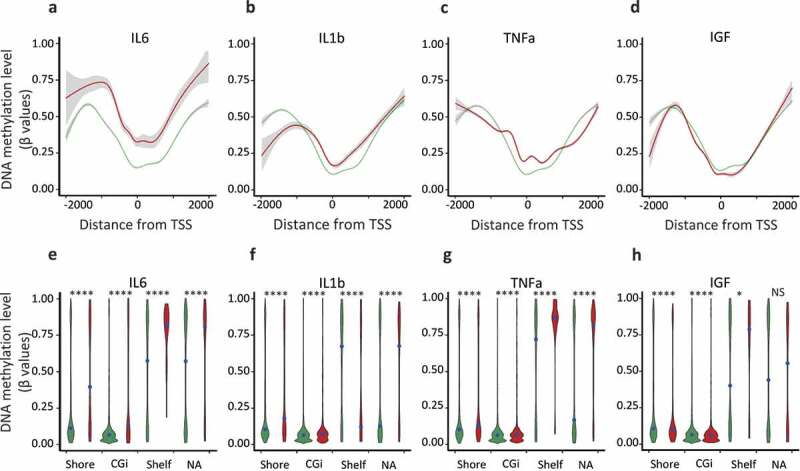
Figure 2.

Hypermethylation of shore regions of genes upregulated upon IL6, IL1b, and TNFa treatments, analysis from Infinium HumanMethylation450K BeadChip data.
Genes were classified as upregulated (FC ≥ 2, FDR < 0.05), unaffected (0.9 < FC < 1.1) and all-TSS for all expressed genes (rpkm > 0.5) when compared with the untreated MCF7 cells. a to d. Average of the DNA methylation level (β-values) of ‘upregulated’ (red lines) and ‘unaffected’ (green lines) genes according to their distance from their TSS, for each CpG, only the distance to the proximal TSS was retained, using the annotation of the Illumina manifest for probes annotation. e to h. Violin plots depicting the DNA methylation density at specific genomic features, DNA methylation level (β-values) of ‘upregulated’ (red violins) and ‘unaffected’ (green violins) genes, CpG islands (CGi), shore regions (Shore), shelf regions (Shelf) and not associated with a specific genomic feature (NA); black point, median value (****p-value < 0.0001, *p-value < 0.05, Welch t-test).
