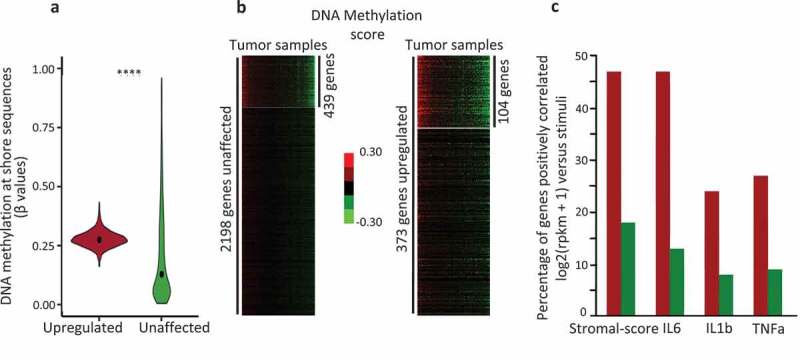
Figure 3.

The genes upregulated by IL6, IL1b, and TNFa are hypermethylated at shore regions, in human breast tumour samples.
a. Violin plot depicting the DNA methylation level at shore sequence located at TSS ± 1kb region of genes identified through MCF7 cells treated with IL1, IL1b, and TNFa in human breast tumours (N = 775); upregulated, red box, genes expressed at least twofold more after either IL1, or IL1b, or TNFa treatments; green box, unaffected genes exhibiting an FC > 0.9 and < 1.1, in MCF7 cells (****p-value < 0.0001, Welch t-test); b. K-means clustering and heat maps of DNA methylation at Shore (TSS ± 1 kb) of upregulated genes (N = 373) and unaffected genes (N = 2,198), 104 (FC2 group) and 439 (FC1 group) differentially methylated genes were identified in the tumours analysed (N = 775). c Percentage of genes with an expression level correlated with either the stromal content of the tumour (stromal-score), IL6, or IL1b, or TNFa; red bars, FC2 group; green bars, FC1 group; from normalized expression values, Spearman’s rank correlation, rho ≤ −0.20, adjusted p-value ≤ 0.05 (Bonferroni method for multiple testing corrections), from normalized expression values.
