
Figure 4.
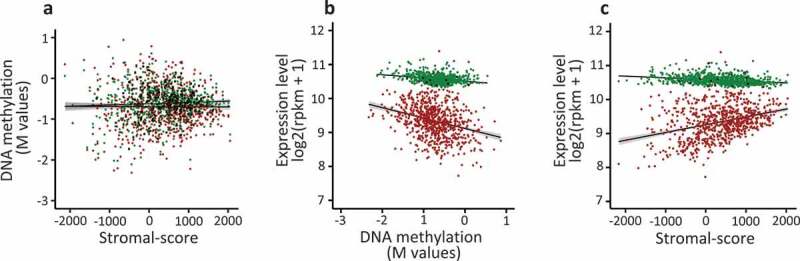
The expression of the FC2 genes is correlated with the stromal cell content of the human breast tumours.
The breast tumour samples (n = 775) from TCGA databank were analysed in order to investigate the correlation between DNA methylation, stromal-score and gene expression level. a. For each tumour, mean DNA methylation level at Shores was normalized (log2(β/1- β)) and plotted against the stromal-score of the corresponding tumour; red points, FC2 group (Spearman’s test, rho = −0.025, p-value = 0.493); green points, FC1 group (rho = 0.024, p-value = 0.510). b. As in a, normalized mean expression level was plotted against mean DNA methylation; red points, FC2 group (Spearman’s test, rho = −0.328, p-value < 2.2e-16); green points, FC1 group (rho = −0.252, p-value = 9.924e-13). c. As in a, normalized mean expression level was plotted against the stromal-score; FC2 group (Spearman’s test, rho = 0.325, p-value < 2.2e-16); green points, FC1 group (rho −0.322, p-value < 2.2e-16).