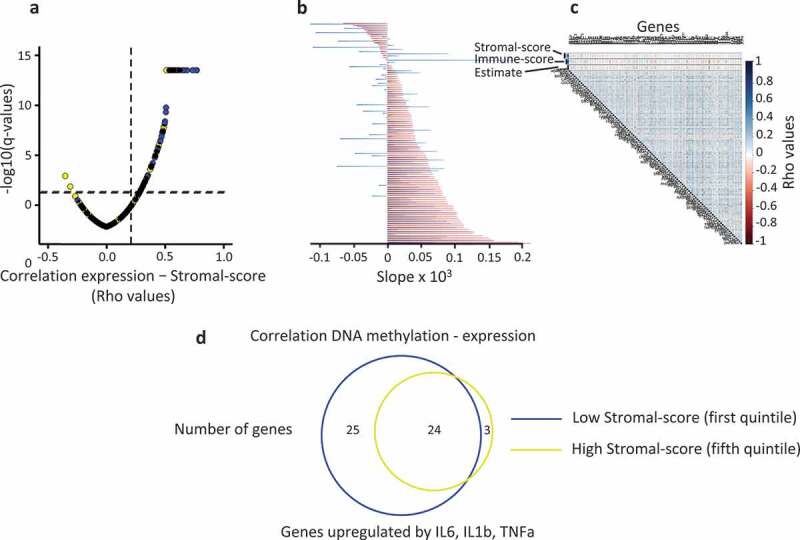
Figure 5.

Tumour microenvironment impacts the relationship between DNA methylation and gene expression, in human breast cancer.
a. Tumours (TCGA databank, N = 775) were classified in quintiles according to the mean DNA methylation level for each gene of the FC2 group; Pearson correlation coefficients (rho) between the normalized expression of each gene and the stromal-score plotted against the adjusted p-value; blue points, the most methylated tumours (fifth quintile); yellow points, the least methylated tumours (first quintile); vertical dashed line, rho = 0.2; horizontal dashed line, q-value = 0.05. b. Slope of the correlation shown in a; for each gene, a linear model was used; red bars, fifth quintile; blue bars, first quintile. c. Correlation matrix between DNA methylation (M-values) and stromal-score for individual genes. d. Venn diagram depicting the overlap between the genes (FC2 group) harbouring a negative correlation between their expression and their DNA methylation level at their 5ʹ end shore sequences according to the stromal cell content of the tumour. Tumours were divided into quintiles according to their stromal-score; only the highest and lowest scores are shown.
