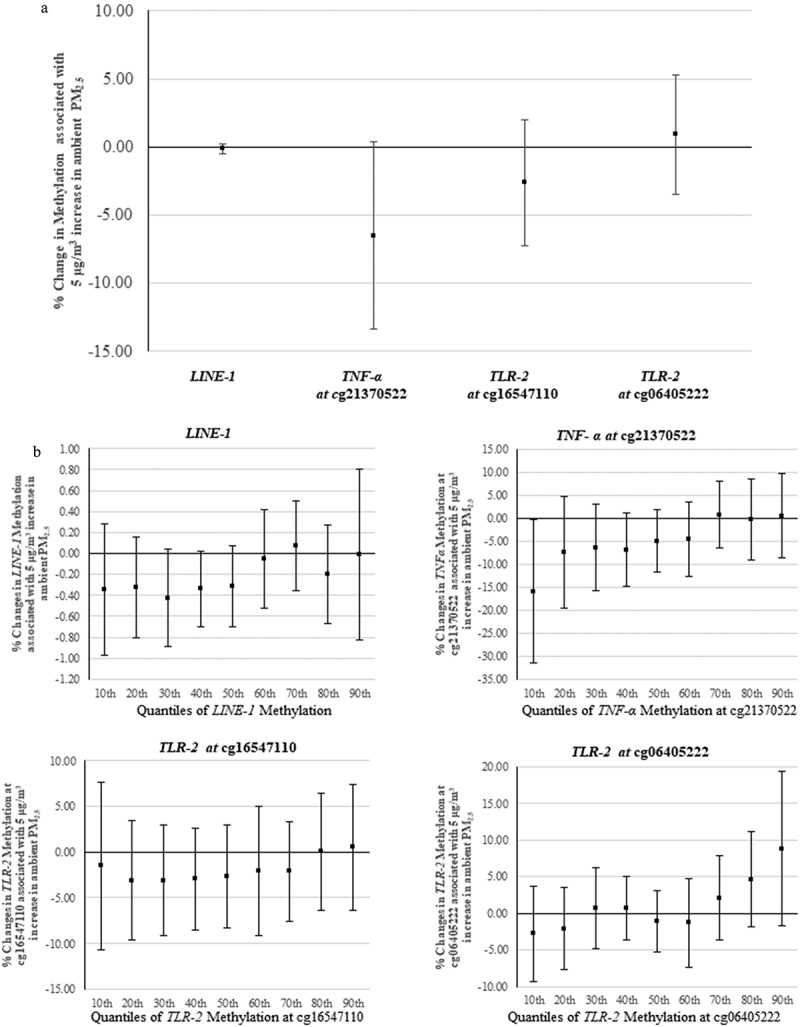
Figure 2.

(a) Percentage change in DNA methylation associated with a 5 µg/m3 increase in ambient PM2.5, results from linear regression. The X-axis refers to different genes; the Y-axis refers to the corresponding changes (mean and 95% confidence interval). (b) Percentage change in DNA methylation associated with a 5 µg/m3 increase in ambient PM2.5 at each decile of the methylation. The X-axis refers to different quantiles; the Y-axis refers to the corresponding changes (mean and 95% confidence interval). (Number of subjects in LINE-1 analyses is 491; number of subjects in locus-specific analysis is 882).
LINE-1: long interspersed nucleotide element; TNF-α: tumour necrosis factor-alpha; TLR-2: toll-like receptor-2; PM2.5: particulate matter with aerodynamic diameter less than or equal to 2.5 µm.
