Figure 1.

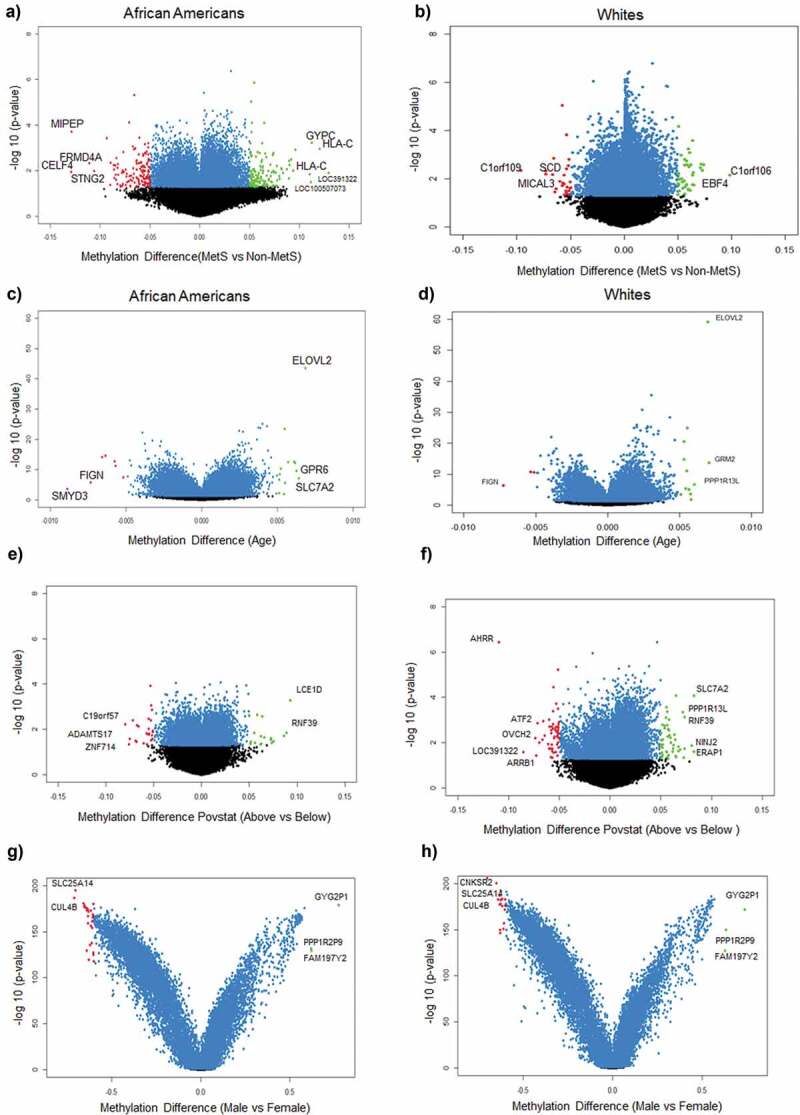
Volcano plots of differentially methylated positions between MetS and non-MetS in each race (a) DMPs associated with MetS in AAs (b) DMPs associated with MetS in Whites (c) DMPs associated with age in AAs (d) DMPs associated with age in Whites (e) DMPs associated with poverty status in AAs (f) DMPs associated with poverty status in Whites (g) DMPs associated with sex in AAs (f) DMPs associated with sex in Whites. Blue colour dots represent the genes with p-value<0.05. Green colour dots represent the genes with p-value <0.05 and hypermethylated with positive beta values. Red colour dots represent the genes with p-value <0.05 and hypomethylated with negative beta values. Black colour dots represent the genes that are not statistically significant at a p-value <0.05.
