Figure 2.

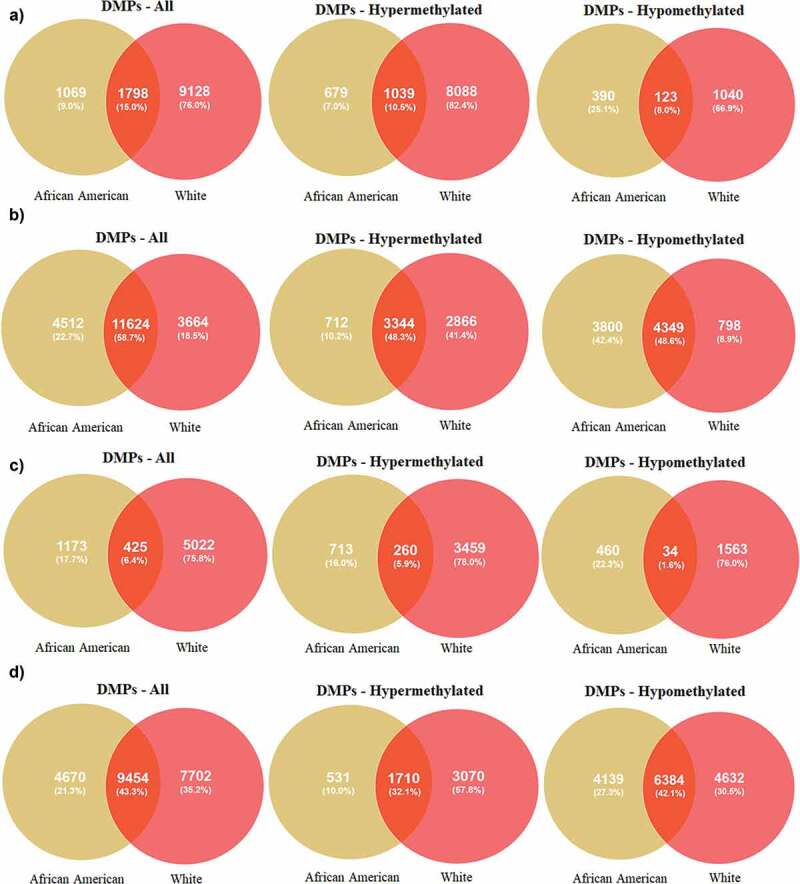
Venn diagrams of significant hyper and hypomethylated DMPs in AAs and Whites (a) DMPs associated with MetS (b) DMPs associated with age (c) DMPs associated with poverty status (d) DMPs associated with sex.

Venn diagrams of significant hyper and hypomethylated DMPs in AAs and Whites (a) DMPs associated with MetS (b) DMPs associated with age (c) DMPs associated with poverty status (d) DMPs associated with sex.