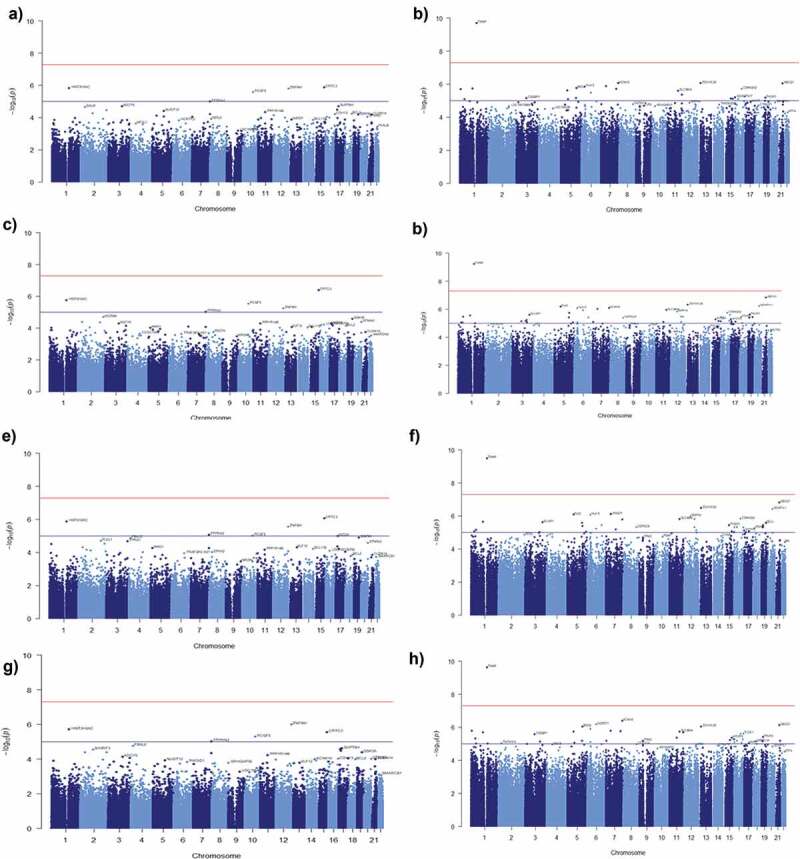
Figure 5.

Manhattan plots showing the results of epigenome-wide association studies (EWAS) of MetS. The model included (a) age (c) poverty status (e) sex (g) age, poverty status and sex as covariates for AA (b) age (d) poverty status (f) sex (h) age, poverty status and sex as covariates for Whites. The bottom (blue) line indicates the FDR-adjusted p-value threshold −log10(1e-5) and the top (red) line indicates the Bonferroni threshold for genome-wide significance threshold −log10(5e-8).
