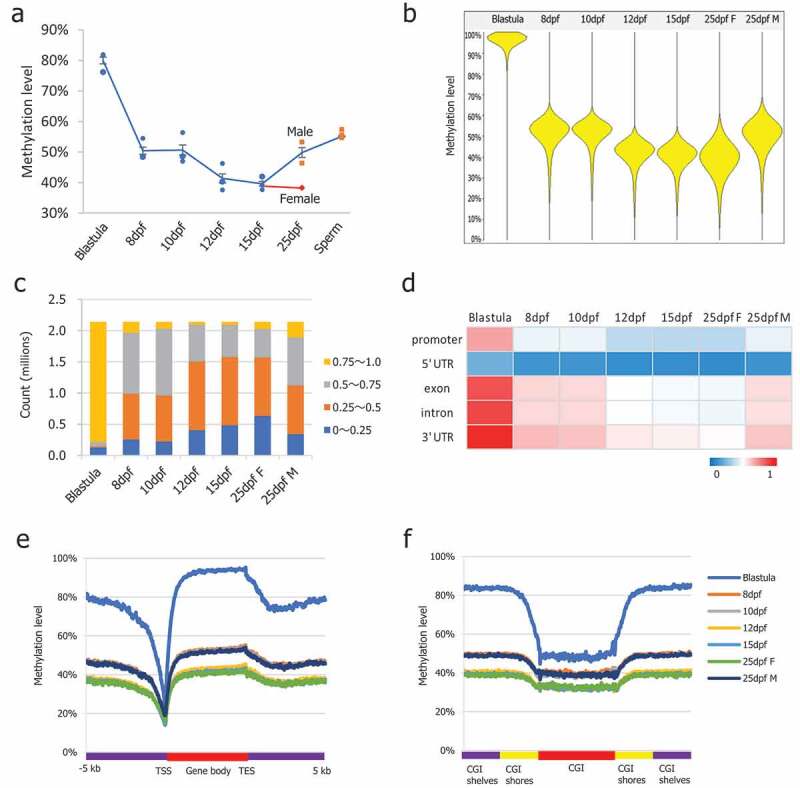
Figure 1.

DNA methylation dynamics in medaka PGCs. (a): Global CpG methylation levels observed in PGCs at different stages of life history; (b): Beanplots showing the distribution of CpG methylation levels of the pooled replicates of medaka blastula and PGCs. Methylation was quantitated by taking 5 kb genomic probes approach; (c): Distribution of CpG methylation levels across the genome; (d): Average CpG methylation of the genomic features in PGCs at different stages of life history; (e): Average CpG methylation profiles over all medaka annotated genes starting from 5 kb upstream (−5 kb) of the transcription start site (TSS), through scaled gene bodies to 5 kb downstream (+5 kb) of transcription end sites (TESs); (f): Average CpG methylation profiles over all medaka CpG islands, CGI shores, and CGI shelves.
