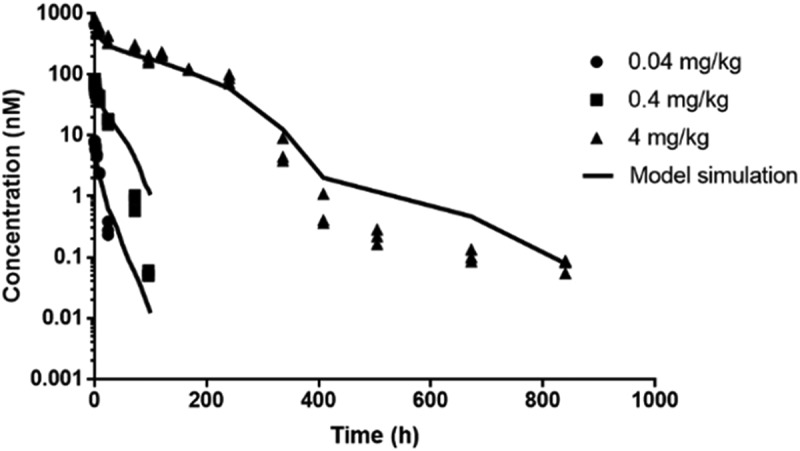
Figure 4.

Serum concentration (nM) vs. time (h) for anti-muIL-36 R (M616) in female C57BL/6 mice after intravenous injection of 0.04, 0.4 and 4 mg/kg fitted to a TMDD model. Solid lines represent model fitted profile. Data points represent raw data (n = 3 mice/time point).
