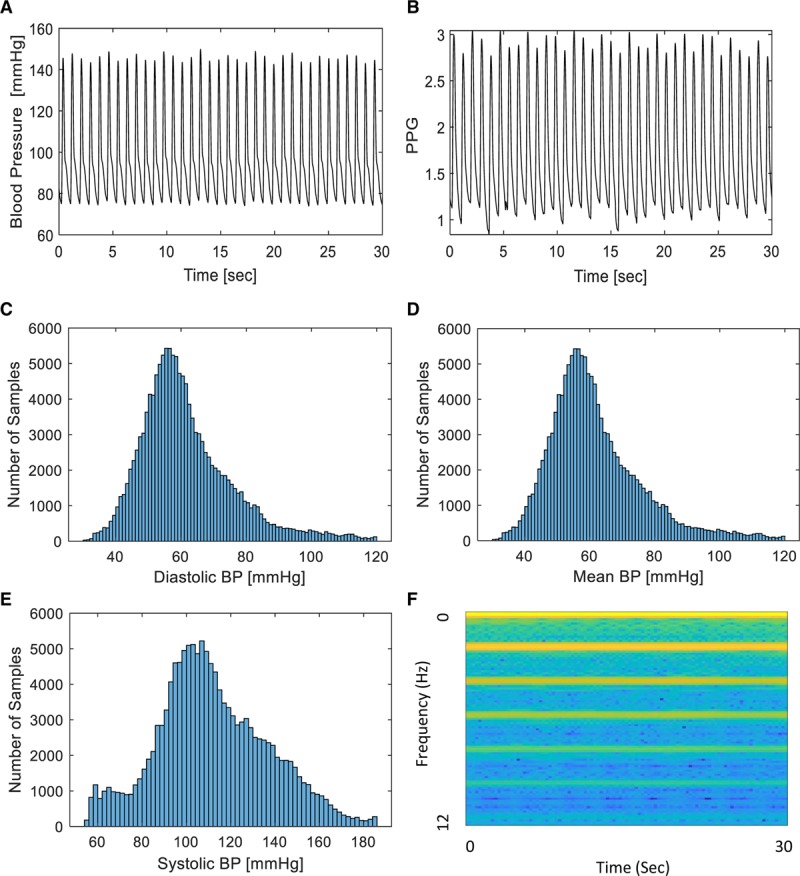
Figure 1.

Signal samples and architecture overview. A, Arterial blood pressure (BP) trace from a single patient recorded at 125 Hz. B, Photoplethysmography (PPG) trace from the same patient, recorded at 125 Hz. C, Histogram of samples included in this study with a calculated diastolic BP as denoted on the x-axis. D, Histogram of samples included in this study with a calculated mean BP as denoted on the x-axis. E, Histogram of samples included in this study with a systolic BP as denoted on the x-axis. F, Sample spectrogram of the PPG signal.
