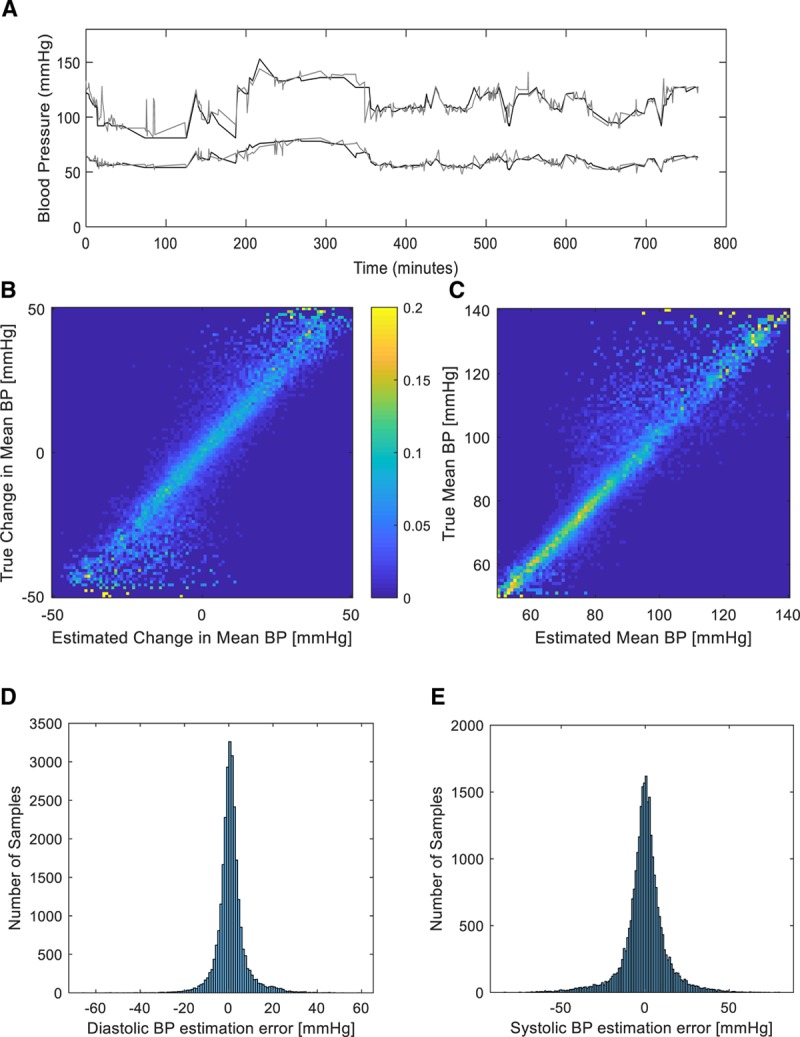
Figure 3.

Blood pressure (BP) tracking and estimation performance. A, Sample trace of systolic and diastolic true (as measured by the invasive arterial line, depicted in black) BP readings from one patient over several hours and the associated estimated BP (depicted in gray) derived from the phtoplethysmographic signal and the Siamese estimation network. B, Two-dimensional histogram (normalized per true change, i.e., row-wise) of estimated versus actual true mean BP fluctuations for the entire test dataset, with a maximal fluctuation size of 50 mm Hg. Probability is coded using a color bar as shown. C, Two-dimensional histogram (normalized per true value, i.e., row-wise) of estimated versus actual true mean BP for the entire test dataset. Probability is coded similarly to (C). D, Histogram of estimation errors for diastolic BP as derived for the full test dataset. E, Histogram of estimation errors for systolic BP as derived for the full test dataset.
